December 2024 Market Update: Small Stands Tall

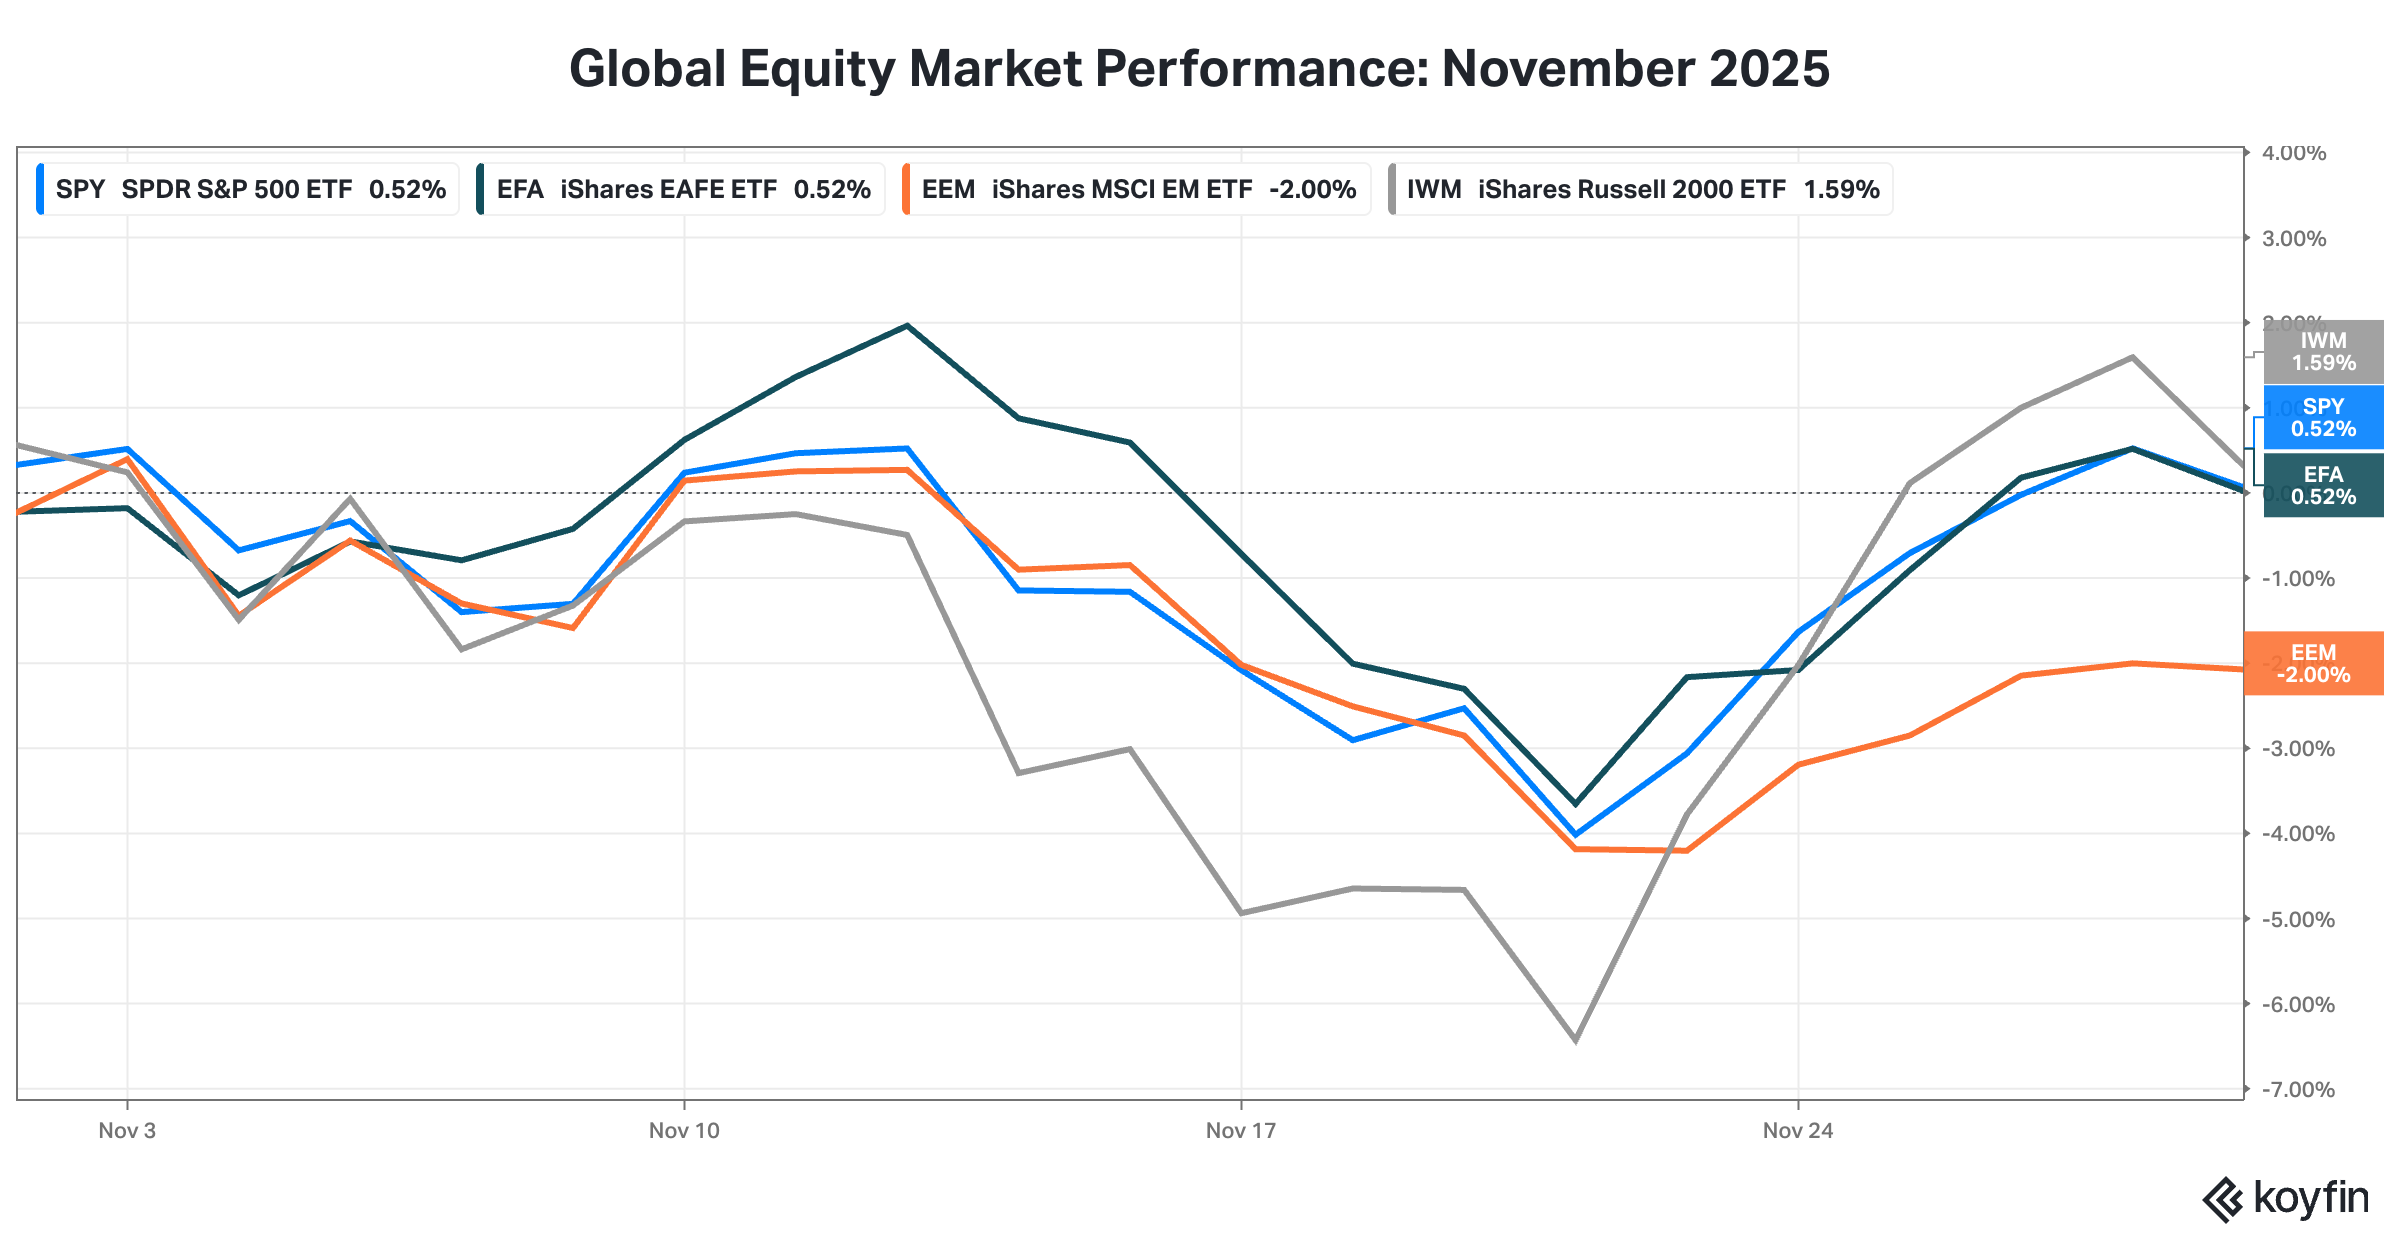
1. Investors crowned U.S. small cap equities as the biggest winner of the U.S. election.

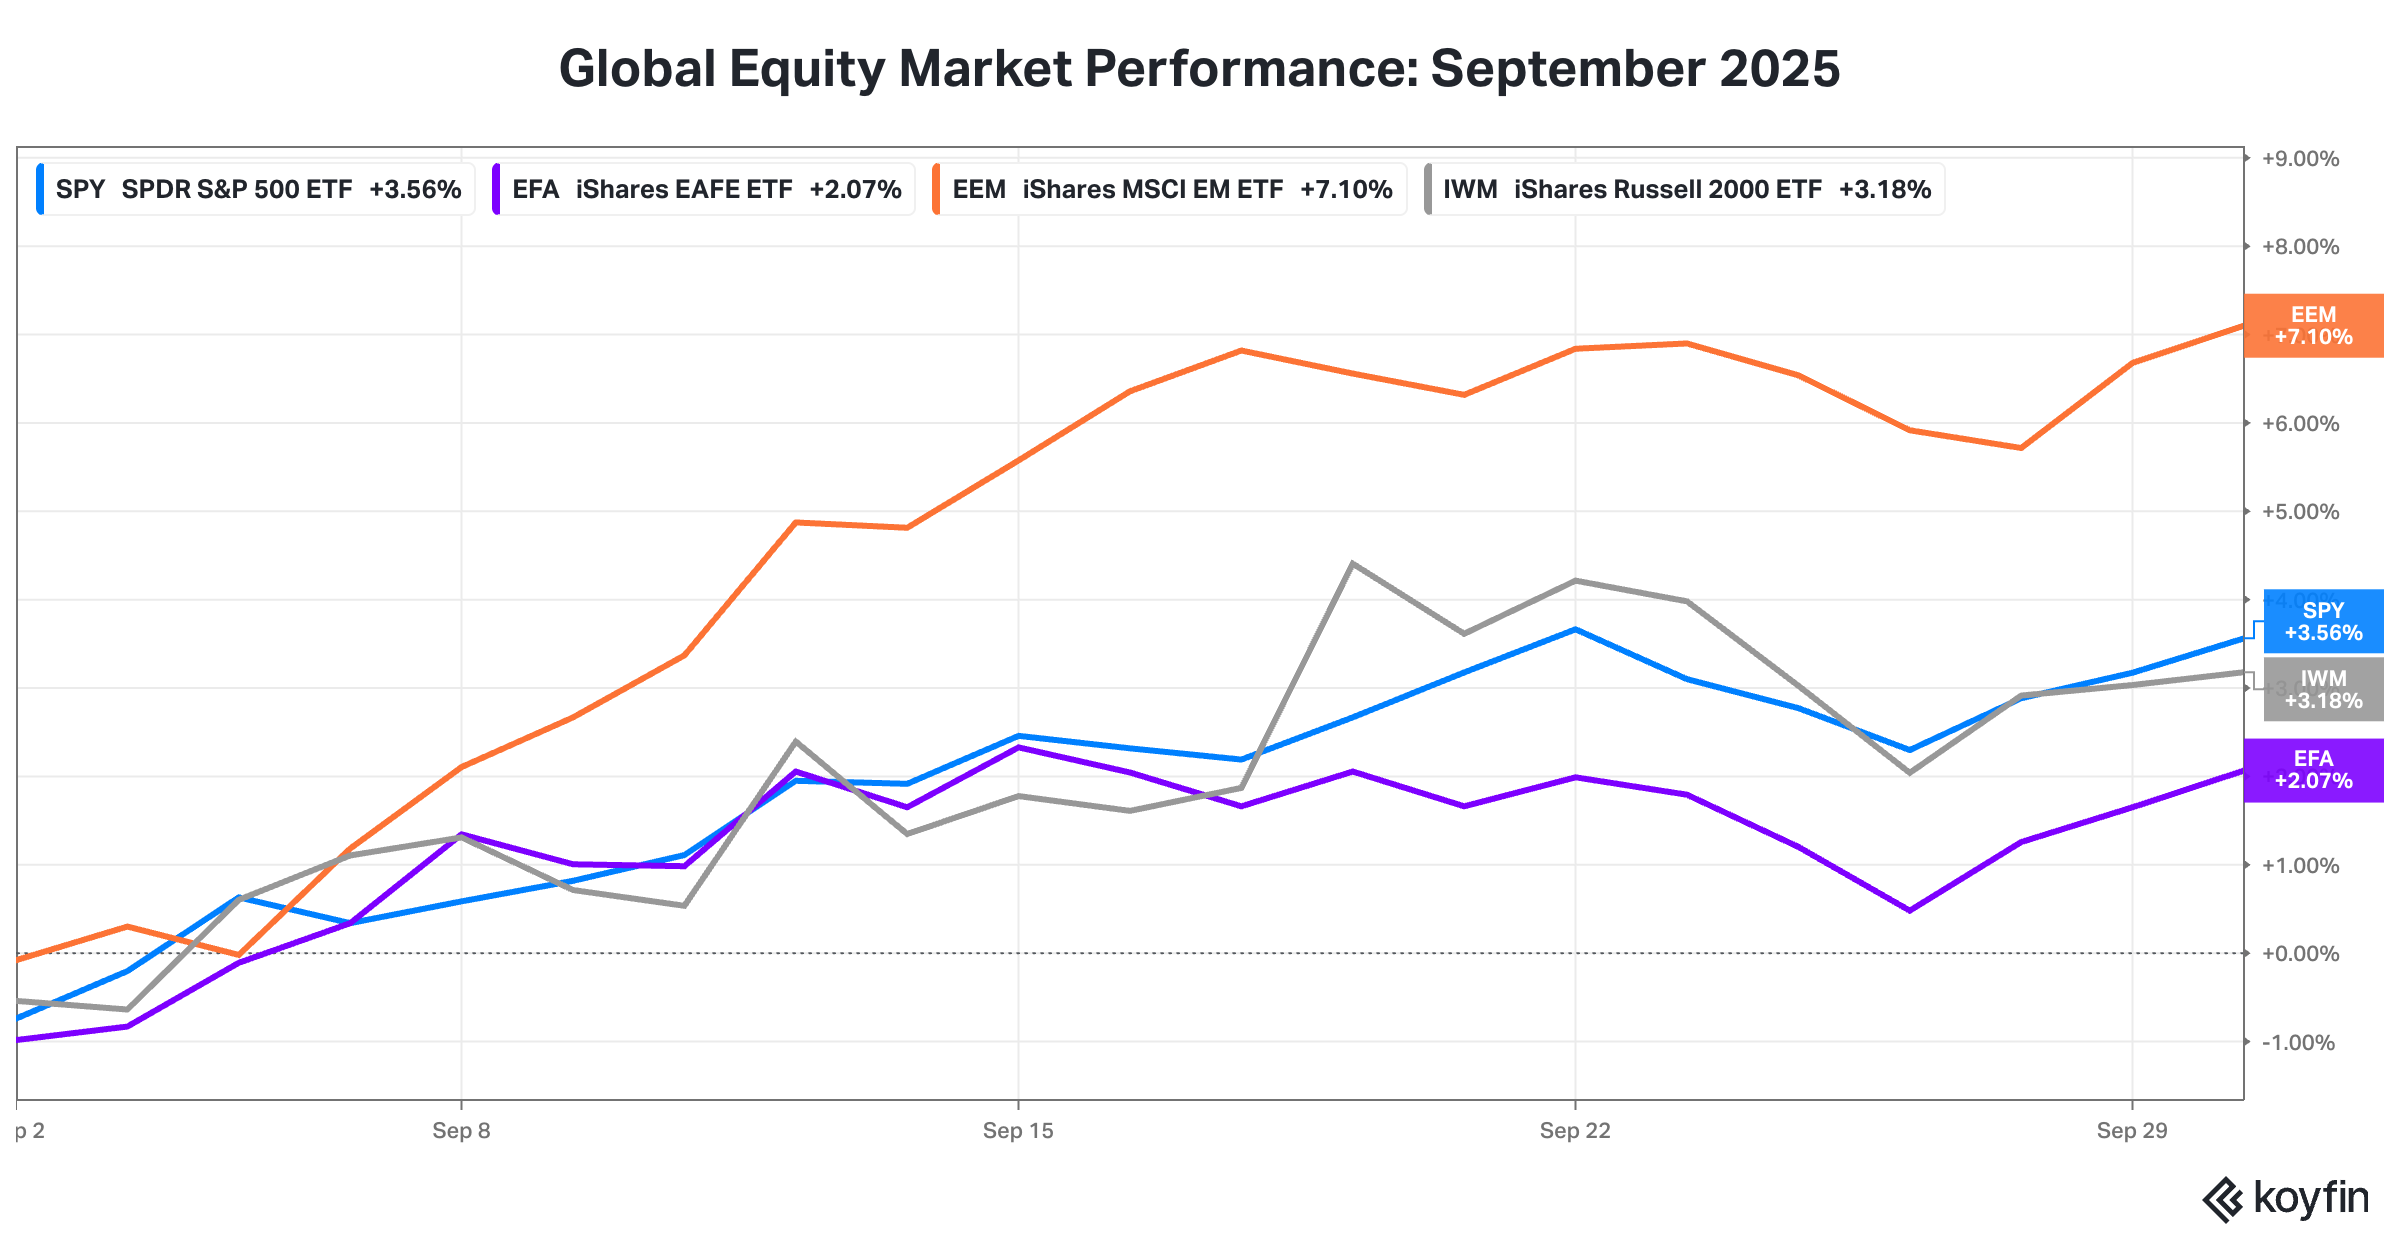
U.S. small cap stocks rallied almost 11% in November on the back of the results of the U.S. election. U.S. large cap stocks had a strong month too, surging almost 6%.

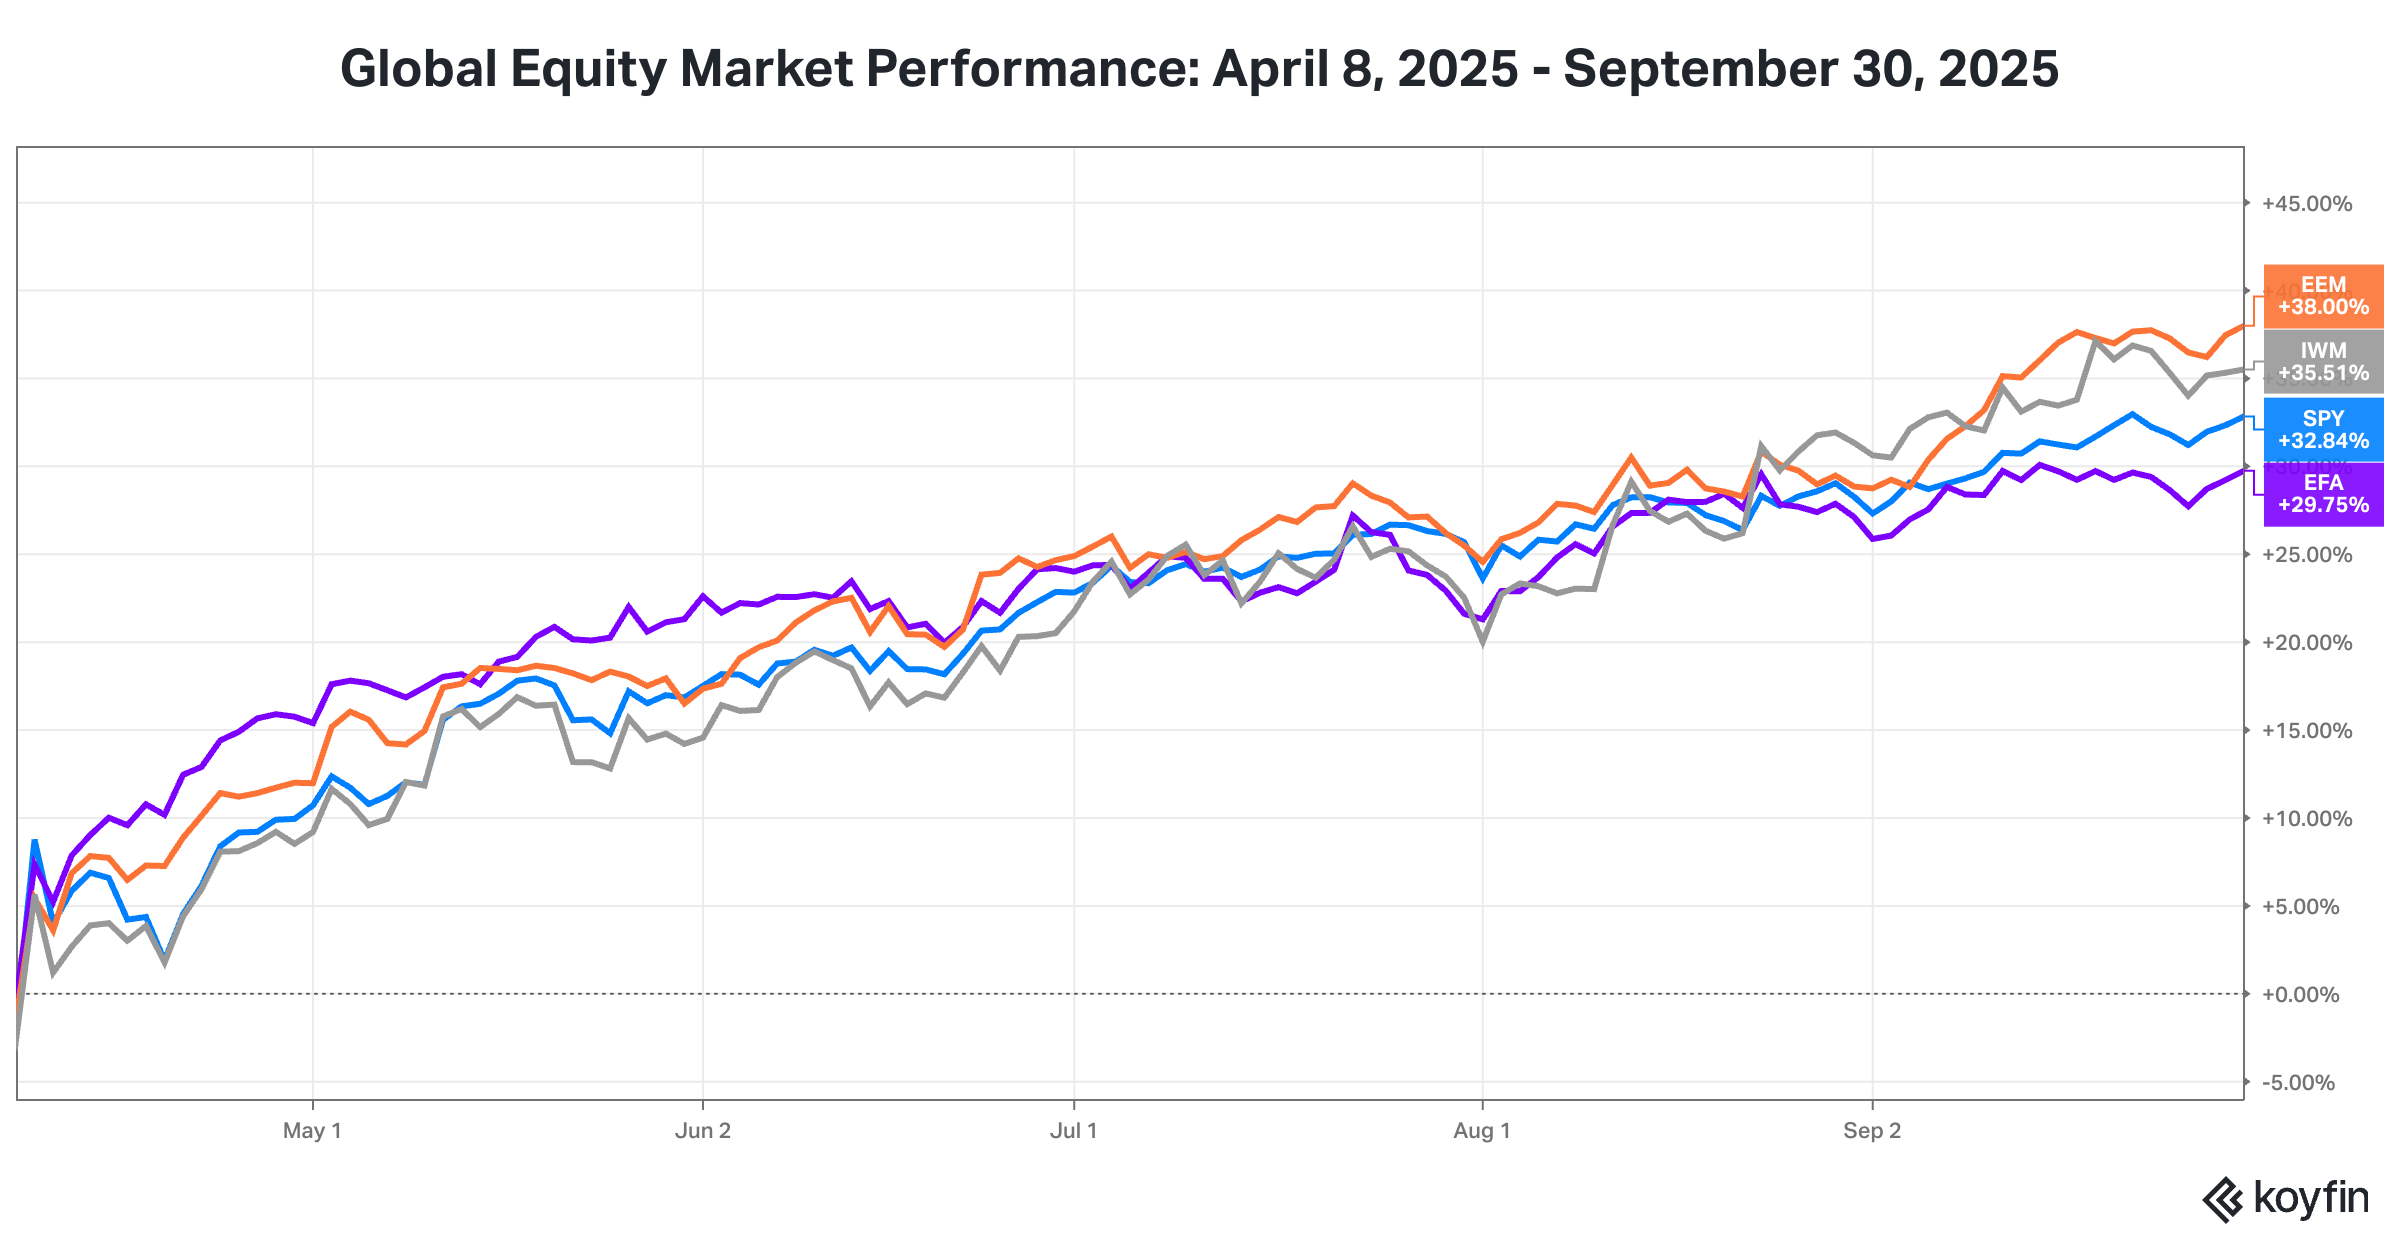
2. The outperformance on U.S. large cap equities over the last decade, especially over the trailing three and half years, is striking.

The U.S. economy has delivered stronger economic growth than most other countries and U.S. companies, especially  information technology companies, have delivered stronger earnings than their foreign counterparts. However, U.S. equity market valuations have risen sharply while non-U.S. developed markets and emerging markets valuation have declined, in anticipation of current economic and corporate earnings trends being permanent. Some retracing in valuations is likely in the next few years, favoring non-U.S. equities.

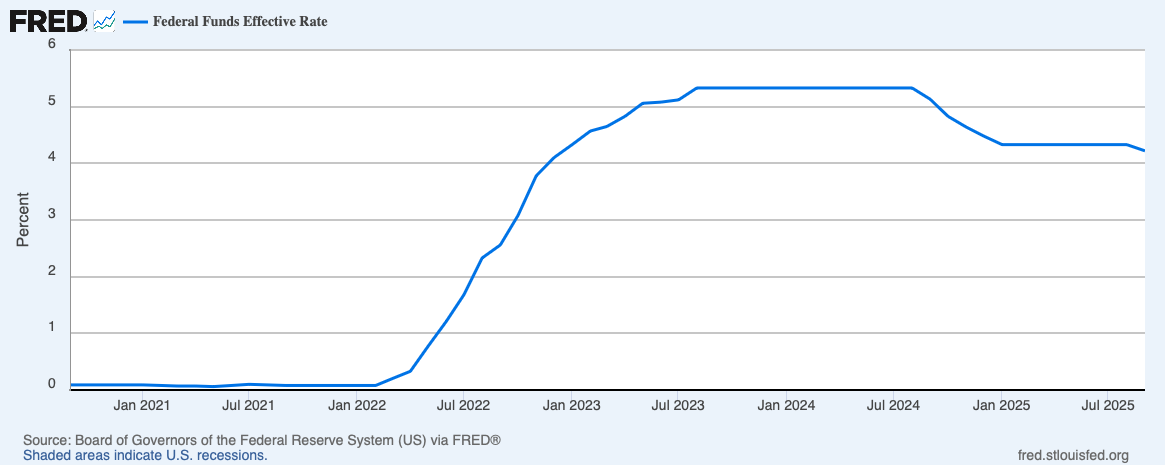
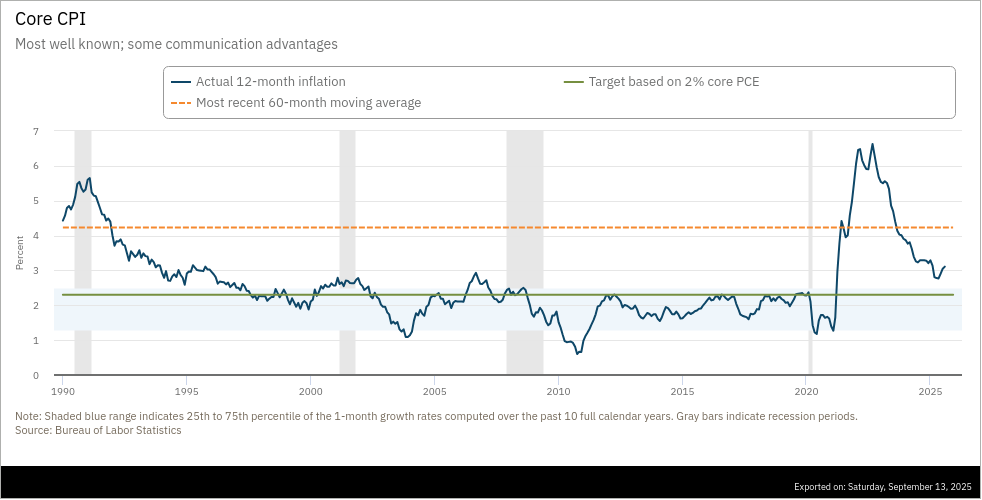
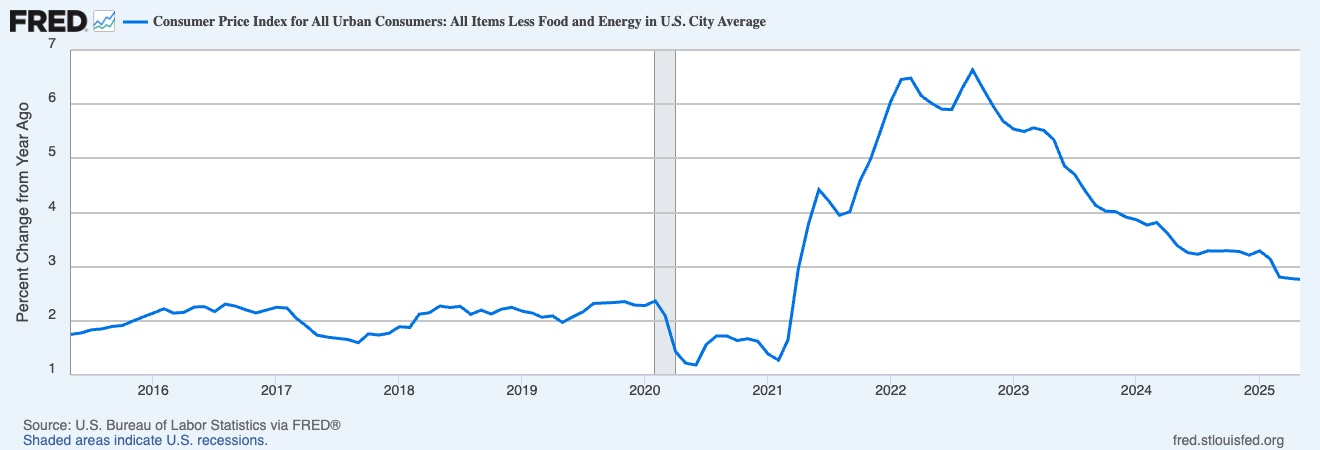
3. Both financial markets and the Federal Reserve have become concerned the rate of inflation has plateaued above 3% and will not revert to its pre-pandemic trend of 2% anytime soon without a recession.

The “core” inflation rate (CPI excluding food and energy) remains over 1% above pre-pandemic levels. Second waves of inflationary pressure are also not uncommon throughout history. The Atlanta Federal Reserve Bank’s measure of “sticky price” inflation (think rent, insurance and medical care) is running a hair below a 4% annual rate.

4. The dust has settled regarding U.S. government elections and while there is still some fog clouding the picture of investment implications, there are a few clear takeaways.

First, tariffs and the threat of tariffs will be used by the incoming Trump Administration as a negotiating tool, especially when dealing with China and its mercantilist tendencies. Donald Trump has been singing the same tariff tune for four decades, starting in the 1980s with his concerns about the Japan export engine that at the time was dominating world trade in goods.

Second, the Trump Administration will lighten the regulatory burden facing U.S. businesses, especially small business.

Third, energy policy will shift to an increased focus on natural gas and nuclear energy for power generation relative to wind and solar.

November 2024 Market Update: U.S. Large Cap Equities Remain Preeminent

1. The U.S. equity market continues to outperform.

In October, the U.S. equity market, as proxied by the S&P 500 Index, declined near 1% but still outperformed non-U.S. markets. The multi-year trend of U.S. outperformance remains intact.

This chart shows the performance of SPY (SPDR S&P 500 Index ETF in blue), EFA (iShares MSCI EAFE ETF in purple), and EEM (iShares MSCI Emerging Markets ETF in orange).

This chart shows the performance of SPY (SPDR S&P 500 Index ETF in blue), EFA (iShares MSCI EAFE ETF in purple), and MCHI (iShares MSCI China ETF in red).

2. By the end of October, the ten-year U.S. Treasury yield had risen 64 bps post the Federal Reserve cutting the Federal Funds Rate target by 50 bps.

The optimistic interpretation is the Federal Reserve has not only facilitated a soft landing but has given a boost to economic growth. If the ten-year yield continues to rise it will be a concerning sign that the bond market is losing faith in the Fed’s inflation fighting credentials.

Source: treasury.gov, Two Centuries Investments

3. Inflation continues to moderate, but we need to observe an extended period of low inflation to be certain the inflation genie is back in the bottle.

The “core” inflation rate (CPI excluding food and energy) has continued to creep down but also remains over 1% above pre-pandemic levels. Second waves of inflationary pressure are also not uncommon throughout history. The Atlanta Federal Reserve Bank’s measure of “sticky price” inflation (think rent, insurance and medical care) is still running at a 4% annual rate.

4. As we write this update, the dust has settled regarding U.S. government elections but there is still plenty of fog clouding the picture of investment implications. We will provide more insights in next month’s update.

Thus far, through November 15, financial markets have crowned U.S. equities as the winner.

October 2024 Market Update: To Ease or Not To Ease

1. China’s equity market surged in late September with the announcement of monetary and fiscal stimulus.

This chart shows the performance of SPY (SPDR S&P 500 Index ETF in blue), EFA (iShares MSCI EAFE ETF in purple), EEM (iShares MSCI Emerging Markets ETF in orange), and MCHI (iShares MSCI China ETF in dotted red).

China’s stock market rose over 20% in September.

The People’s Bank of China (PBOC) eased monetary policy and the fiscal authorities announced new spending initiatives with the objectives of boosting the economy and supporting the stock market.

  • Lowered the benchmark seven-day reverse repo rate from 1.7 % to 1.5%.

  • Lowered the one-year medium-term lending facility loan rate to some financial institutions 2.3% to 2.0%.

  • Aimed to reduce existing mortgage rates by 0.5%.

  • Reduced the Required Reserve Ratio applicable to banks by 0.5%.

  • Established a 500 billion yuan (US$70.9 billion) facility to allow security houses, fund-management firms and insurance companies to tap liquidity when purchasing stocks.

  • Established a lending facility of 300 billion yuan, with an interest rate of 1.75% to incentivize banks to support listed companies’ stock buy-backs and purchases.

  • Reduced down payment ratio on second-home purchases from 25% to 15%.

Over the last fifteen years, China’s economy has slowed from a 10% growth rate in 2009 to a growth rate of less than 5% currently. The slowdown raises concerns about sustaining employment and social unrest.

China did an amazing job of marshaling labor and physical capital to create the second largest economy in the world and significantly boost the living standards of its citizens. However, China has struggled to expand its services sector, boost domestic consumption and increase total factor productivity via innovation.

Public equity shareholders have suffered. Productivity gains did not accrue to shareholders. The magnitude of underperformance of China’s equity market to the U.S. equity market is astounding.

This chart shows the performance of SPY (SPDR S&P 500 Index ETF in blue), EFA (iShares MSCI EAFE ETF in purple), and MCHI (iShares MSCI China ETF in red).

Monetary easing, amplified by fiscal stimulus, is the “easy” first step. For China to sustainably boost economic activity, boost the stock market, and support the real estate market, China will need to consider rebalancing its economy and altering many regulations and incentives.

2. On September 18th, the Federal Reserve lowered the target for the federal funds rate by 50 basis points, to a range of 4.75% to 5.00%, despite inflation rate still exceeding the Fed’s 2% target, solid employment data, and mixed signals about economic activity.

While the Federal Reserve beat the PBOC to the monetary easing punch bowl, the Fed’s less aggressive easing and bullish sentiment towards U.S. equities produced a more muted bounce for U.S. equities.

Interestingly, the ten-year Treasury yield rose 15 basis points in the days subsequent to the Fed’s announcement and finished the month only 10 basis points lower than it started the month.

The optimistic interpretation is the Fed is facilitating a soft landing and giving a boost to future economic growth. If the ten-year yield continues to rise it will be a concerning sign that the bond market is losing faith in the Fed’s inflation fighting credentials.

3. The European Central Bank will likely cut rates in October as inflation has moderated and the real economic growth rate hovers around a miniscule 0.6%.

Source: Eurostat

Eurozone inflation dipped below 2% for the first time since mid-2021.

4. The BOJ (Bank of Japan) faces a dilemma with the PBOC, the Fed and the ECB in easing mode.

Source: Japan Government Statistics

The BOJ raised its policy rate 20 basis points in March and 15 basis points in July. Its current rate of 0.25% reflects Japan’s unique situation, namely a few decades of no inflation and a post-pandemic bounce in inflationary pressure that was muted compared to the spikes in the U.S. and Europe.

The BOJ was the last major central bank to raise its policy rate to fight inflation. Its tightening of monetary policy in July with the threat of more to come was the likely catalyst for the global equity market volatility in early August.

The challenge for the BOJ is the inflation rate in Japan has halted its decline and started rising again. The most likely course for the BOJ is to sit on the sidelines for now. It is unlikely BOJ is unlikely to raise its policy rate any time soon with synchronized monetary easing occurring in the other major economic blocs.

5. In the U.S., inflationary pressures also continued to ease.

In the U.S., the headline inflation rate has plateaued over 1% above pre-pandemic levels. In the last five months it has started to creep down.

The “core” inflation rate (excludes food and energy) has continued to creep down but also remains over 1% above pre-pandemic levels.

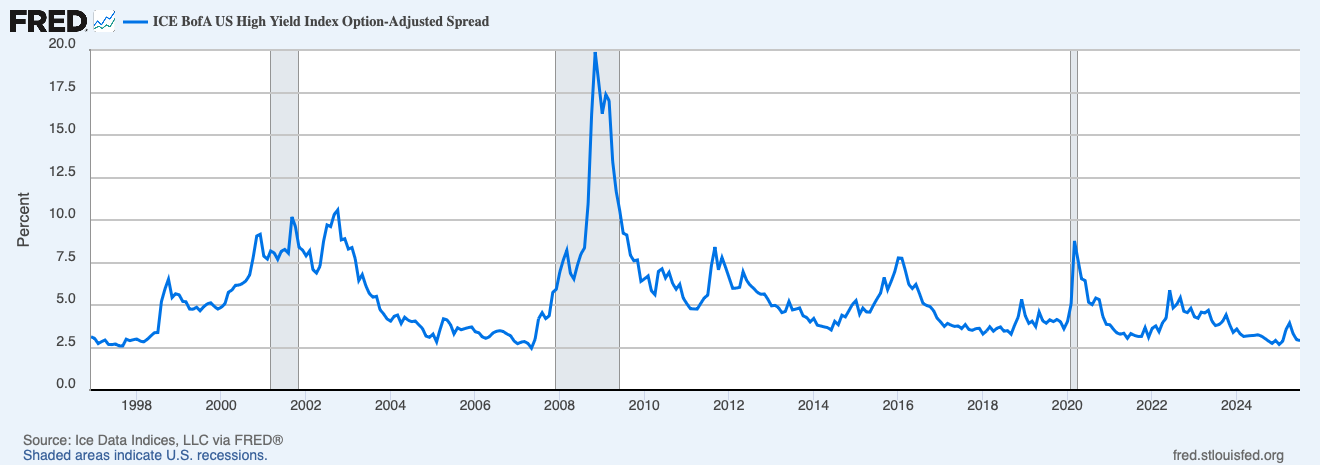
6. U.S. high yield credit spreads remain well below levels that signal a brewing recession.

High yield credit spreads were a hair above 3% at the end of September.

September 2024 Market Update: Rotation or Recession?

1. Global equity markets sold off in early August but recovered by month end.

This chart shows the performance of SPY (SPDR S&P 500 Index ETF in blue), EFA (iShares MSCI EAFE ETF in purple), EEM (iShares MSCI Emerging Markets ETF in orange), and EWJ (iShares MSCI Japan ETF in dotted red).

The primary impetus for the rapid sell-off in global equities seemed to be fears of a Japan Yen carry trade unwind after comments by the Bank of Japan (BOJ) about more increases in its policy rate. The BOJ raised its policy rate to 0.25% on July 31. When the BOJ walked back its hawkish comments, equity markets began to recover. 

The incident highlights the current high sensitivity of risky asset prices to reductions in financial leverage by levered investors.

2. Below the surface, dividend payers outperformed for second month in a row. Low volatility stocks led the way in August. These occurrences point to a market rotation away from risk and toward more stable stocks, especially those that are interest rate sensitive.

Source: S&P Dow Jones Indices

Source: S&P Dow Jones Indices

Momentum and growth stocks, especially the so-called Magnificent Seven mega cap stocks, have delivered historically strong performance since mid-2023. The question is whether recent equity market activity marks a broadening of performance and a catch-up by the lagging sectors and factors or proverbial canary in the coal mine, Equity market performance in the first several days of September, after the bout of volatility in early August, hints at burgeoning equity market weakness after a surge in stock prices over the last 22 months.

Source: S&P Dow Jones Indices

3. The good news is the behavior of high yield credit spreads. After jumping 90 basis points from their July lows, high yield spreads reversed course, declining once again to well below their long-term average.

High yield credit spreads were trending downward over the last year until the bout of volatility in early August.

High yield credit spreads remain well below levels that signal a brewing recession or financial crisis.

4. Markets are now pricing in several federal funds rate cuts by the Federal Reserve. Since May month end, the two-year Treasury yield has declined by 100 basis points.

5. Inflationary pressures are starting to ease. Inflation remains a headwind for investors seeking high real returns (real return = nominal return - rate of inflation).

In the U.S., the headline inflation rate had plateaued over 1% above pre-pandemic levels. In the last three months it has started to creep down.

The “core” inflation rate (excludes food and energy) has continued to creep down but also remains over 1% above pre-pandemic levels.

Due to sticky inflation, the FOMC has kept the effective federal funds rate at 5.33% for the past year.

We discussed the inflation challenge in more detail in April’s market update.

https://www.twocenturies.com/blog/2024/4/13/april-2024-market-update-will-the-real-fed-funds-rate-please-stand-up

6. While inflationary pressures are easing, economic growth is also slowing down. The recent earnings reports from the dollar stores point to economic challenges facing lower income consumers.

This chart shows the performance of various consumer related stocks in August 2024.

WMT (Walmart Inc. in orange), COST (Costco Wholesale Corp. in yellow), ROST (Ross Stores, Inc. in green), TJX (The TJX Companies, Inc. in red), MSCI Emerging Markets ETF in orange), DLTR (Dollar Tree, Inc. in purple) and DG (Dollar General Corporation in blue).

In August, both Dollar General and Dollar Tree reported disappointing revenue growth and forecast weak volume growth going forward. While the stock prices of other consumer related stocks (consumer staples and off price) benefited from the market rotation, the dollar store stocks were crushed by pull back in purchases by lower income consumers. If a recession is brewing, the lower income consumer will likely be a canary in the proverbial coal mine.

August 2024 Market Update: uh-Moh

1. U.S. small cap stocks rocketed higher in July. Year-to-date, U.S. large cap stocks continue to outperform.

This chart shows the performance of SPY (SPDR S&P 500 Index ETF in purple), EFA (iShares MSCI EAFE ETF in blue), EEM (iShares MSCI Emerging Markets ETF in orange), and IWM (iShares Russell 2000 ETF in grey).

This chart shows the performance of SPY (SPDR S&P 500 Index ETF in purple), EFA (iShares MSCI EAFE ETF in blue), EEM (iShares MSCI Emerging Markets ETF in orange), and IWM (iShares Russell 2000 ETF in grey).

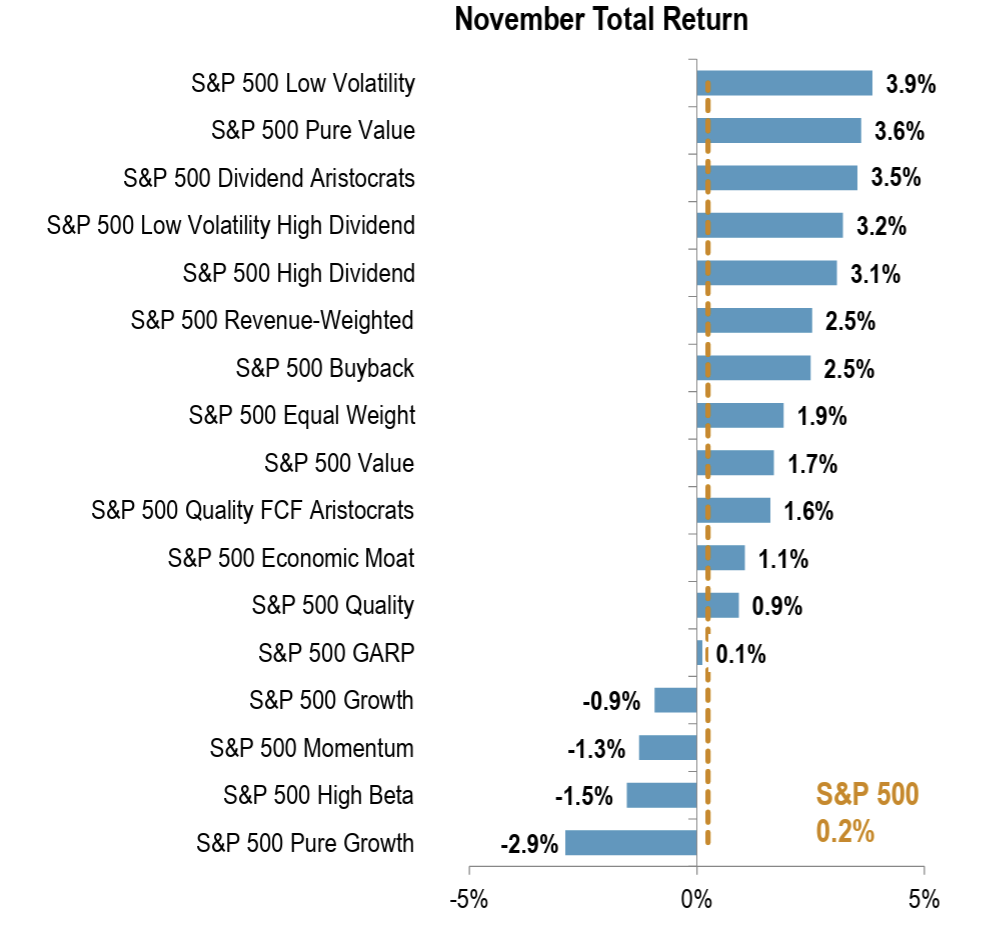
2. Below the surface, investors rotated away from momentum and growth stocks, which were the big winners over the last twelve months. Dividend payers and value stocks outperformed.

Source: S&P Dow Jones Indices

Source: S&P Dow Jones Indices

The question is whether the market rotation away from momentum and growth stocks, especially the so-called Magnificent Seven mega cap stocks, represents a broadening of market strength or is the proverbial canary in the coal mine. Equity market performance in the first several days of August hints at burgeoning equity market weakness after a twenty-one month surge in stock prices.

3. Gold continues to glitter, with no loss of price momentum.

This chart shows the performance of SPY (SPDR S&P 500 Index ETF in blue), GLD (SPDR Gold Trust in yellow), DXY (U.S. Dollar Index in green), and IEF (iShares 7-10 Year Treasury Bond ETF in purple).

Gold typically underperforms in periods of U.S. Dollar strength, when inflation is declining, and when long-term interest rates are rising. All three circumstances have occurred this year and yet gold has outperformed. The reason is clear. Strong demand for gold has emanated from the east, with The Central Bank of the People's Republic of China being the biggest buyer.

4. Inflationary pressures are starting to ease. Inflation remains a headwind for investors seeking high real returns (real return = nominal return - rate of inflation).

In the U.S., the headline inflation rate had plateaued over 1% above pre-pandemic levels. In the last three months it has started to creep down.

The “core” inflation rate (excludes food and energy) has continued to creep down but also remains over 1% above pre-pandemic levels.

Due to sticky inflation, the FOMC has kept the effective federal funds rate at 5.33% for the past year.

We discussed the inflation challenge in more detail in April’s market update.

https://www.twocenturies.com/blog/2024/4/13/april-2024-market-update-will-the-real-fed-funds-rate-please-stand-up

5. Despite sticky inflation and no rate cuts by the FOMC, U.S. financial conditions remain loose and U.S. credit markets remain sanguine.

Over the last few months, the Chicago Fed’s National Financial Conditions Index has been signaling looser financial conditions, suggesting monetary policy is not restrictive despite 525 basis points of federal funds rate increases over the last two years.

6. Corporate earnings are on pace to increase almost 11% year-over-year in the second quarter, the best growth rate since 4q 2021.

July 2024 Market Update: Momo in the Driver's Seat

1. U.S. large cap stocks continue to outperform year-to-date.

This chart shows the performance of SPY (SPDR S&P 500 Index ETF in purple), EFA (iShares MSCI EAFE ETF in blue), EEM (iShares MSCI Emerging Markets ETF in orange), and IWM (iShares Russell 2000 ETF in grey).

2. Stocks with strong 12-month price momentum (the momo factor) have been standpoint performers in 2024.

Source: S&P Dow Jones Indices

Source: S&P Dow Jones Indices

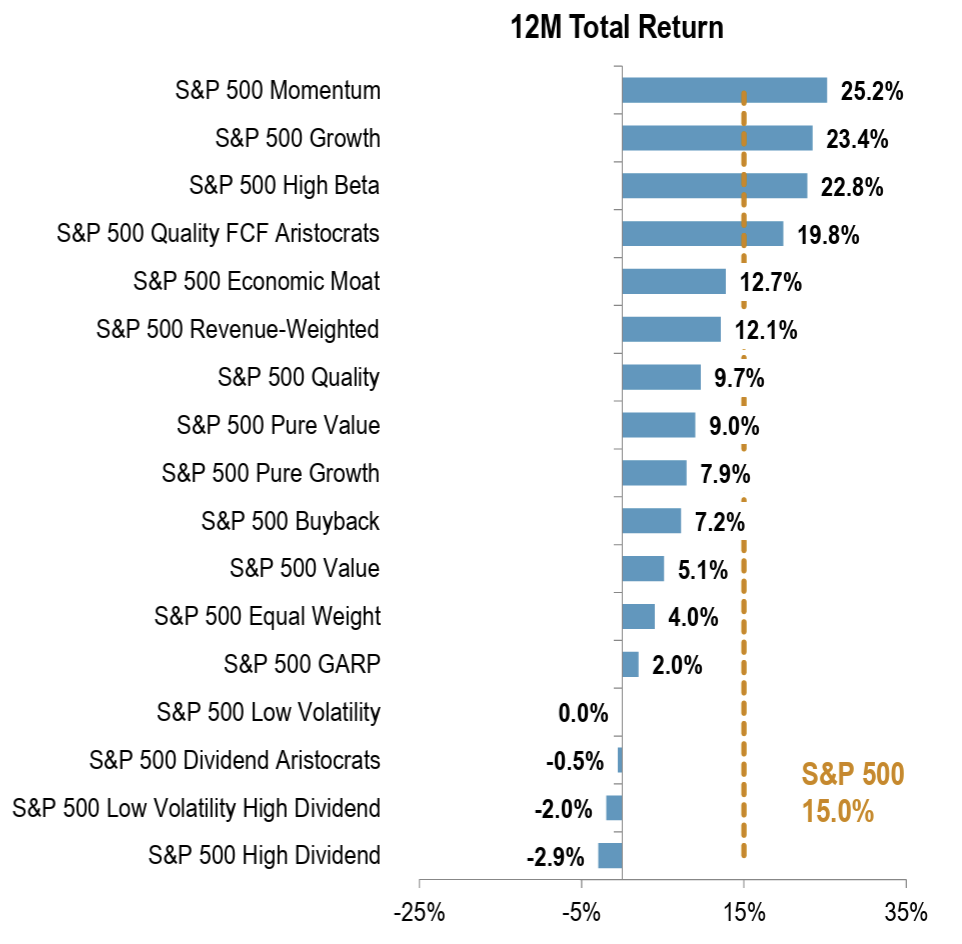
Year-to-date within the S&P 500 Index universe, the momentum factor (orange bars in the charts above) has returned almost 34% year-to-date and outperformed the index by almost 19%.

Over the last 12 months, the momentum factor has returned 57.9%, crushing the S&P 500 Index return of 24.6%.  S&P Dow Jones Indices noted this magnitude of outperformance last occurred in August 2000 at the end of the dot-com boom.

3. In a surprise, gold has been the other outperforming asset class.

This chart shows the performance of SPY (SPDR S&P 500 Index ETF in purple), GLD (SPDR Gold Trust in yellow), DXY (U.S. Dollar Index in green), JNK (SPDR Bloomberg High Yield Bond ETF in orange), IEF (iShares 7-10 Year Treasury Bond ETF in blue), and TLT (iShares 20+ Year Treasury Bond ETF in red).

Gold typically underperforms in periods of U.S. Dollar strength, when inflation is declining, and when long-term interest rates are rising. All three circumstances have occurred this year and yet gold has outperformed. The reason is clear. Strong demand for gold has emanated from the east, with The Central Bank of the People's Republic of China being the biggest buyer.

4. Inflationary pressures are starting to ease. Inflation remains a headwind for investors seeking high real returns (real return = nominal return - rate of inflation).

In the U.S., the headline inflation rate had plateaued over 1% above pre-pandemic levels. In the last three months it has started to creep down.

The “core” inflation rate (excludes food and energy) has continued to creep down but also remains over 1% above pre-pandemic levels.

Due to sticky inflation, the FOMC has kept the effective federal funds rate at 5.33% for the past year.

We discussed the inflation challenge in more detail in April’s market update.

https://www.twocenturies.com/blog/2024/4/13/april-2024-market-update-will-the-real-fed-funds-rate-please-stand-up

5. Despite sticky inflation and no rate cuts by the FOMC, U.S. financial conditions remain loose and U.S. credit markets remain sanguine.

Over the last few months, the Chicago Fed’s National Financial Conditions Index has been signaling looser financial conditions, suggesting monetary policy is not restrictive despite 525 basis points of federal funds rate increases over the last two years.

At month end June 2024. high yield bond spreads remained subdued and had settled almost 200 basis points below the long-term average and well below recent peaks.

June 2024 Market Update:April Showers Bring May Flowers

1. Global equity markets rebounded in May after a weak April.

This chart shows the performance of SPY (SPDR S&P 500 Index ETF in purple), EFA (iShares MSCI EAFE ETF in blue), EEM (iShares MSCI Emerging Markets ETF in orange), and IWM (iShares Russell 2000 ETF in grey).

2. Equity investors have enjoyed strong returns year-to-date.

This chart shows the performance of SPY (SPDR S&P 500 Index ETF in purple), EFA (iShares MSCI EAFE ETF in blue), EEM (iShares MSCI Emerging Markets ETF in orange), and IWM (iShares Russell 2000 ETF in grey).

3. Bond investors haven’t fared as well due to the increase in interest rates at intermediate and long maturities.

Source: www.treasury.gov, Two Centuries Investments

4. Sticky inflation, in the face of high public debt and high fiscal deficits in the developed world, remains a big headwind for investors seeking high real returns (real return = nominal return - rate of inflation).

In the U.S., the headline inflation rate has plateaued over 1% above pre-pandemic levels.

The “core” inflation rate (excludes food and energy) has continued to creep down but also remains over 1% above pre-pandemic levels.

Due to sticky inflation, the FOMC has kept the effective federal funds rate at 5.33% for the past year.

We discussed the inflation challenge in more detail in April’s market update.

https://www.twocenturies.com/blog/2024/4/13/april-2024-market-update-will-the-real-fed-funds-rate-please-stand-up

5. Despite sticky inflation and no rate cuts by the FOMC, U.S. financial conditions remain loose and U.S. credit markets remain sanguine.

Over the last few months, the Chicago Fed’s National Financial Conditions Index has been signaling looser financial conditions, suggesting monetary policy is not restrictive despite 525 basis points of federal funds rate increases over the last two years.

At month end May 2024. high yield bond spreads remained subdued and had settled almost 200 basis points below the long-term average and well below recent peaks.

May 2024 Market Update: Markets of Confusion

1. In April, the multi-month rally in global equity markets stalled.

This chart shows the performance of SPY (SPDR S&P 500 Index ETF in purple), EFA (iShares MSCI EAFE ETF in blue), EEM (iShares MSCI Emerging Markets ETF in orange), and IWM (iShares Russell 2000 ETF in grey).

2. Over the last two months, gold has shined brightly relative to other asset classes.

This chart shows the performance of SPY (SPDR S&P 500 Index ETF in purple), EFA (iShares MSCI EAFE ETF in blue), EEM (iShares MSCI Emerging Markets ETF in orange), IWM (iShares Russell 2000 ETF in grey), GLD (SPDR Gold Trust in yellow), TLT (iShares 20+ Year Treasury Bond ETF in red) and DXY (U.S. Dollar Index in green).

The strong performance of gold over the last two months is surprisingly given both the increase in U.S. Treasury yields of between 40 and 45 basis points at the 5-year, 10-year, and 30-year maturities, and the increase in the U.S. dollar versus other currencies. Gold almost always underperforms when U.S. Treasury yields increase and the U.S. dollar appreciates.

The PBoC, China’s central bank, and Chinese citizens have been big buyers of gold. The buying points to a possible devaluation of the Chinese yuan and also highlights the PBoC’s aversion to increasing its holdings of U.S. Treasury securities.

3. The Japanese Yen has certainly lost it lustre and its decline versus the U.S. Dollar has recently accelerated.

The acceleration in yen weakness poses a dilemma for the Japanese government.

Inflation, while low compares to other developed market countries, remains high by Japanese standards. Currency weakness reinforces domestic inflationary pressures.

On the other hand, raising interest rates to combat currency weakness means a higher interest expense for government debt. Among developed market countries, Japan already has the highest public debt as a percentage of GDP. In addition, the BOJ, Japan’s central bank, owns more than 40% of the debt. Finally, asset markets have used the low interest rates in Japan as a cheap funding source for carry trades. Any rapid rise in short term interest rates could reverberate across global asset markets.

A potential short term solution, namely the BOJ selling central bank reserves of U.S. Treasury securities to support the yen, would like force the U.S. Federal Reserve to adjust it quantitative tightening strategy.

4. Sticky inflation, in the face of high public debt and high fiscal deficits in the developed world, remains a big headwind for investors seeking high real returns (real return = nominal return - rate of inflation).

In the U.S., the headline inflation rate has plateaued over 1% above pre-pandemic levels.

The “core” inflation rate (excludes food and energy) remains 2% above pre-pandemic levels.

The improvement (downtrend) in the rate of inflation has stalled over the last several months. As a result, the FOMC has sat on the sidelines and the effective federal funds rate has sat at 5.33% for the past year.

We discussed the inflation challenge in more detail in last month’s update

https://www.twocenturies.com/blog/2024/4/13/april-2024-market-update-will-the-real-fed-funds-rate-please-stand-up

5. Despite sticky inflation, currency market turmoil, and a gold market warning sign, U.S. financial conditions remain loose and U.S. credit markets remain sanguine.

Over the last few months, the Chicago Fed’s National Financial Conditions Index has been signaling looser financial conditions, suggesting monetary policy is not restrictive despite 525 basis points of federal funds rate increases over the last two years.

At month end April 2024. high yield bond spreads remained subdued and had settled over 1.5% below long-term averages and well below recent peaks.

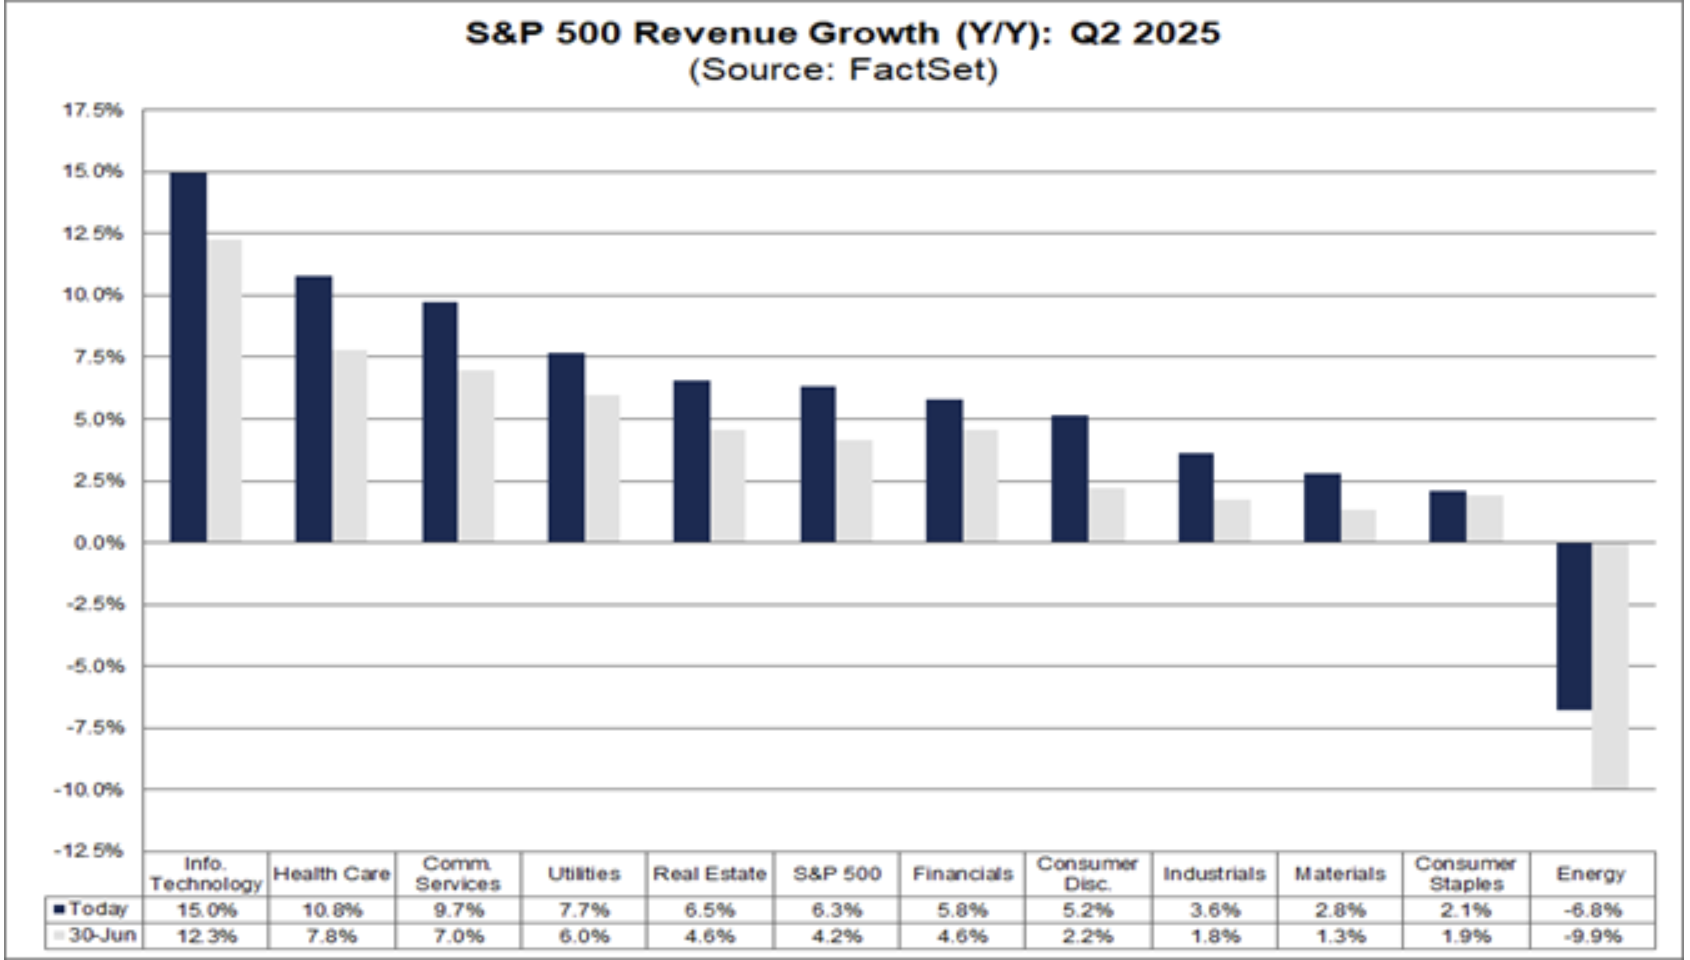
6. Overall, second quarter corporate earnings reports have been solid, albeit not signaling future earnings growth consistent with the elevated valuations for U.S. equities.

With 80% of S&P 500 companies having reported earnings, year-over-year revenue growth has averaged 4.1% and earnings growth has averaged 5.0%.

April 2024 Market Update: Will the Real Fed Funds Rate Please Stand Up

1. In March, global equity markets rose sharply for the second consecutive month.

This chart shows the performance of SPY (SPDR S&P 500 Index ETF in purple), EFA (iShares MSCI EAFE ETF in blue), EEM (iShares MSCI Emerging Markets ETF in orange), and IWM (iShares Russell 2000 ETF in grey).

Since the end of October 2023, U.S. stocks have sizzled. Emerging markets have been dragged down by China.

This chart shows the performance of SPY (SPDR S&P 500 Index ETF in purple), EFA (iShares MSCI EAFE ETF in blue), EEM (iShares MSCI Emerging Markets ETF in orange), IWM (iShares Russell 2000 ETF in grey), and MCHI (iShares MSCI China ETF in red).

2. Will the real federal funds rate please stand up? Inflation remains the most important story for markets. Increased uncertainty over the FOMC’s reaction function adds a new element.

(reader note: real federal funds rate = effective federal funds rate – inflation rate

The headline inflation rate has dropped to about 1% above pre-pandemic levels.

The “core” inflation rate (excludes food and energy) remains 2% above pre-pandemic levels.

The improvement (downtrend) in the rate of inflation has stalled over the last several months. As a result, the FOMC has sat on the sidelines and the effective federal funds rate has sat at 5.33% for the last eight months.

What gives?

From a supply perspective, labor force and energy supply have been the big constraints.

  • Ongoing skills mismatches have led to high wage growth in certain industries, e.g., pilots and machine workers.

  • Higher energy and electricity costs are a result of years of underinvestment in oil exploration and production and nuclear energy generation.

On the margin, other constraints have limited supply, in particular:

  • Underinvestment in infrastructure.

  • Increasing regulation in various industries.

  • Incoherent immigration policy.

  • Geopolitical frictions.

From a demand perspective, there have been two “surprises”.

  • The “long and variable lag” of monetary policy tightening in reducing economic demand has been quite long versus historical precedent and not as impactful as projected.

    • Many large corporations extended debt maturities when interest rates were low pre-2022.

    • Since the U.S. housing market is largely financed with 15-year and 30-year fixed rate mortgages, most existing homeowners have not faced re-financing risk.

    • Many household and business had significant cash holdings or built-up cash holdings during the pandemic and have benefitted from higher interest income.

  • The U.S. federal government has engaged in an unprecedented spending spree over the last several years, which has boosted demand but has not boosted supply.

The deflationary forces of globalization, competition and technology innovation have yet to win out. Maybe they will.

In the meantime, what is the Federal Reserve (FOMC) to do?

The FOMC has three official mandates, namely maintain full employment, keep prices stable, and serve as lender of last resort in a crisis. The FOMC has also operated as if it has a fourth mandate, namely support risky asset prices. Over the last four decades, the Fed has not had to worry about price stability. Globalization was a strong deflationary force.

Now it faces the challenge of balancing its mandates.

  • Maintaining full employment is particularly important in an election year.

  • After a strong rally, U.S. large cap equity valuation multiples appear to be factoring in federal funds rate cuts.

  • Many banks are facing the prospect of credit losses on commercial real estate loans (mostly offices in urban centers) and credit losses on leveraged loans as the rise in short term interest rates starts to bite. On the other hand, financial conditions remain loose, according to the Chicago Fed’s National Financial Conditions Index.

  • Inflation, especially services inflation, has proven sticky. Wage growth in the services sectors is still hovering around a 5% annual growth rate. The Atlanta Fed's sticky-price consumer price index (CPI), a weighted basket of items that change price relatively slowly was up 4.4% on a year-over-year basis in February.

Investors keep changing their expectation for rate cuts. In October, investors were pricing in three rate cuts (using the upper end of current federal funds rate range of 5.25% to 5.50%). By January, they were pricing in seven rate cuts. By the end of March, they are back to pricing in three rate cuts.

The options market has detected the lack of a clear signal about near term FOMC policy actions.

In the Federal Reserve’s December 2023 note “Elevated Option-Implied Interest Rate Volatility and Downside Risks to Economic Activity”, author Cisil Sarisoy commented on the rise in uncertainty about short term interest rates.

“Measures of uncertainty about U.S. short maturity interest rates derived from options have risen sharply since October 2021, reaching their highest levels in more than a decade. This note first uses survey-based measures of economic uncertainty to argue that this increase in option-implied measures likely reflect higher uncertainty about inflation, the associated monetary policy response, and the perceived resulting downside risks to economic activity. It further shows that increases in implied volatility over the past twenty years have generally been associated with lower future economic activity and larger downside risks.”

3. Credit markets will likely be the canary in the coal mine, as the typically are, if a sustained economic contraction, is forthcoming and large federal funds rate cuts are on the horizon.

At month end March 2024. high yield bond spreads remained subdued and had settled around 1.5% below long-term averages and well below recent peaks.

U.S. leveraged loan default rates also remained subdued, per data from PitchBook | LCD.

March 2024 Market Update: Supercore and Superfour

1. Prices for Services excluding Energy and Housing in the Personal Consumption Expenditure metric, a.k.a. Supercore PCE, spiked in January. Was it a blip or an indication of a resurgence in inflationary pressures?

Inflation remains the most important story for markets.

In January, the prices for services excluding energy and housing within personal consumption expenditures jumped 0.6% month over month. It was one of the four highest month over month increases since the beginning of 2021. Services prices have been much stickier than goods prices and represent the risk that the rate of inflation does not return to its 2% pre-pandemic trend.

The Federal Reserve Bank of Atlanta data shows wage growth across all industries continues to slow, but at a gradual rate. Wage growth is to the extent it reflects a virtuous cycle of sustainable economic activity supported by strong productivity growth. However, it still appears much of the wage growth is tied to structural supply shortages in the labor market.

Higher inflation is problematic for investors and financial markets. Not only does higher inflation translate to higher interest rates and borrowing costs, but it also leads to lower multiples and lower investment returns. The last few decades have been a period of low growth in labor costs and low energy costs, both major drivers of rising corporate profit margins.

The rate of inflation peaked in the late summer 2022 but has not retraced its rise on the way down. It appears to have settled above its pre-pandemic range.

The headline inflation rate has dropped to about 1% above pre-pandemic levels but has plateaued in recent months.

The “Core” inflation rate (excludes food and energy) has proven even stickier and remains 2% above pre-pandemic levels.

2. Global equity markets rose sharply in February, led by China, which has been the big laggard over the prior three months.

This chart shows the performance of SPY (SPDR S&P 500 Index ETF in purple), EFA (iShares MSCI EAFE ETF in blue), EEM (iShares MSCI Emerging Markets ETF in orange), IWM (iShares Russell 2000 ETF in grey), and MCHI (iShares MSCI China ETF in red).

Since the end of October 2023, U.S. stocks have sizzled.

This chart shows the performance of SPY (SPDR S&P 500 Index ETF in purple), EFA (iShares MSCI EAFE ETF in blue), EEM (iShares MSCI Emerging Markets ETF in orange), IWM (iShares Russell 2000 ETF in grey), and MCHI (iShares MSCI China ETF in red).

3. In the first two months of 2024, performance of the so-called Magnificent Seven has diverged. It looks more like the Super Four.

This chart shows the performance of NVDA (NVIDIA Corporation in orange), META (Meta Platforms, Inc. in blue), AMZN (Amazon.com, Inc. in yellow), MSFT (Microsoft Corporation in purple), SPY (SPDR S&P 500 Index ETF in grey), GOOGLE (Alphabet Inc. in red), AAPL (Apple Inc. in green), and TSLA (Tesla, Inc. in blue/grey).

Year-to-date, NVDA, META, AMZN, and MSFT have outperformed the S&P 500 Index, while GOOGL, AAPL, and TSLA have underperformed.

4. Treasury yields rose across the curve in February, with the three-year yield experiencing the biggest jump.

Source: www.treasury.gov, Two Centuries Investments

5. Credit markets will likely be the canary in the coal mine, as the typically are, if a sustained economic contraction is forthcoming.  

At month end February 2024. high yield bond spreads remained subdued and had settled around 1.5% below long-term averages and well below recent peaks. Good news for sure.

February 2024 Market Update: A Difficult Juggling Act

1. Global equity markets stumbled out of the gate in January with U.S. large cap stocks and Japan stocks as the only major categories to finish the month in the green.

This chart shows the performance of SPY (SPDR S&P 500 Index ETF in purple), EFA (iShares MSCI EAFE ETF in blue), EEM (iShares MSCI Emerging Markets ETF in orange), IWM (iShares Russell 2000 ETF in grey), MCHI (iShares MSCI China ETF in red), and EWJ (iShares MSCI Japan ETF in green).

A slow start to the year is not surprising given the swift and strong global equity market rally over the last two months of 2023.

2. Treasury yields barely budged in January after the sharp decline into year-end.

Source: www.treasury.gov, Two Centuries Investments

3. Inflation remains the most important story for markets.

Inflation impacts the level and shape of the Treasury yield curve. Inflation has historically impacted equity valuation multiples. High inflation has led to lower multiples and lower investment returns. The last few decades have been a period of low growth in labor costs and low energy costs, both major drivers of rising corporate profit margins.

The rate of inflation peaked in the late summer 2022 but has not retraced its rise on the way down. It appears to have settled above its pre-pandemic range.

The headline inflation rate has dropped to about 1% above pre-pandemic levels but has plateaued in recent months.

The “Core” inflation rate (excludes food and energy) has proven even stickier and remains 2% above pre-pandemic levels.

4. The Federal Reserve faces a juggling act between employment, inflation, and its “other” mandate of ensuring financial system stability.

Structural supply shortages, most notably in the labor market, have reduced the effectiveness of tighter monetary policy in reducing inflationary pressures. Tighter monetary policy operates by increasing the cost of debt capital and thus, with a lag, puts downward pressure on the demand for goods and services. All else equal, less demand means lower wage growth and lower prices.

While the Federal Reserve Bank of Atlanta data shows wage growth across all industries continues to slow, there are many industries facing supply shortages. Over the last several months, United Airlines, American Airlines, and Southwest Airlines pilots were able to negotiate approximately 40% wage increases over the next four years. UPS union employees negotiated wage increases near 20% over five years and the UAW (United Auto Workers) negotiated 25% general pay increases plus cost-of-living adjustments over the next four years for the Big 3 auto workers.

The housing market is also experiencing a supply shortage. Despite higher mortgage loan rates, demand for housing remains high due to a demographic bump (children of baby boomers) in the age cohort (ages 25-40) with the highest percentage of new home buyers.

In addition, when interest rates were low prior to the 2022 spike, many corporations refinanced debt and either increased maturities or increased the percentage of fixed rate debt relative to floating rate debt. In other words, they companies have yet to feel the full brunt of the increase in interest rates. Over the next five years, over $4 trillion in corporate bonds will need to be refinanced at higher yields, as illustrated by the chart below from Calamos Investments, who used data sourced from the ICE BofA US Corporate Index and the ICE BofA High Yield Index, as of 10/19/23.

Bloomberg published a similar chart on September 29, 2023 showing the debt maturity wall for U.S. and European issuers.

Lastly, the Fed needs to consider the impact of shrinking its balance sheet on intermediate and long maturity Treasury yields at a time when the Department of the U.S. Treasury will be increasing the percentage of notes and bonds it issues going forward and reducing the percentage of Treasury bills.

In summary, the Federal Reserve is hoping to avoid dealing with any further trade-off between real GDP growth (the volume of goods and services being transacted) and inflation (the price of goods and services being transacted). The Fed also has to be careful not to further impair the capital position of the regional banks, most of whom are dealing with increased credit losses on commercial real estate loans. Recent comments from Federal Open Market Committee voting members reveal the Fed is more worried about a provoking a recession and damaging credit creation by banks than it is about pushing inflation lower in the near term.

5. Despite the Federal Reserve raising the federal funds rate target by 5.25% over a relatively short period, real economic growth has not collapsed, though it remains muted.

Real gross domestic product (GDP) and real gross domestic income (GDI) have diverged over the last few quarters. GDP data shows the economy humming along, while GDI data  points to an economic slowdown.

6. Industrial activity and the manufacturing sector remain mired near recession levels, despite pockets of strong activity.

The recent weakness in industrial activity is apparent when viewed in the context of five-year and thirty-year trends.

With 46% of S&P 500 companies having reported quarterly earnings, the sectors with the lowest revenue growth are energy, materials, utilities, and industrials, namely the sectors most closely tied to industrial activity. The solid revenue growth in the information technology sector has been largely driven by software companies, while the semi-conductor companies most closely tied to industrial activity have reported weak revenue growth.

7. Economic growth has been supported by a massive increase in fiscal spending.

This fiscal deficit is still at levels only seen during recessionary periods when tax receipts decline and fiscal spending increases.

8. Consumer spending has been the other pillar of economic activity.

However, U.S. consumer debt growth is running well above economic growth. The strength in consumer spending is increasingly driven by borrowing and less by wage income growth, a concerning development.

9. Inventory levels bear watching.

As of November 2023. the inventory-to-sales ratio had risen from post pandemic lows to the upper end of its post 2002 range.

10. Credit markets will likely be the canary in the coal mine, as the typically are, if a sustained economic contraction is forthcoming.  

At month end January 2024. high yield bond spreads had settled around 1.5% below long-term averages and well below recent peaks. Good news for sure.

January 2024 Market Update: A Swift Rebound in Equity Markets at Year End

1. Global equity markets rallied for the second straight month in December.

This chart shows the performance of SPY (SPDR S&P 500 Index ETF in purple), EFA (iShares MSCI EAFE ETF in blue), EEM (iShares MSCI Emerging Markets ETF in orange) and IWM (iShares Russell 2000 ETF in grey).

2. The two-month rally was swift and strong. Small cap equities led the way in the U.S. equity market.

This chart shows the performance of SPY (SPDR S&P 500 Index ETF in purple), EFA (iShares MSCI EAFE ETF in blue), EEM (iShares MSCI Emerging Markets ETF in orange) and IWM (iShares Russell 2000 ETF in grey).

3. Global equities had an excellent year, led by the so-called magnificent seven U.S. mega-cap stocks. China was the big laggard.

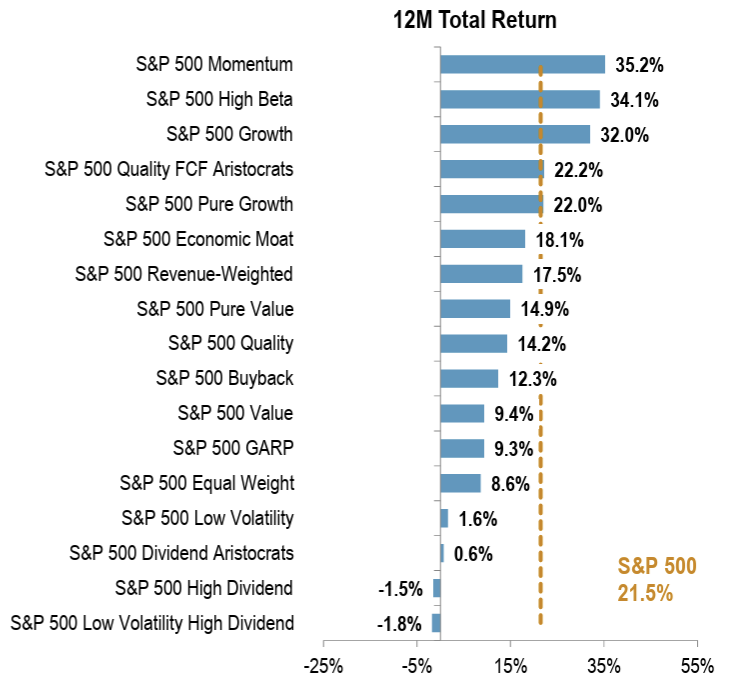
4. From a factor perspective in the U.S. equity market, high beta stocks were the outperformers in December and for full year 2023, while low volatility stocks were the laggards.

These charts show the performance of SPY (SPDR S&P 500 Index ETF in purple), SPHB (Invesco S&P 500 High Beta ETF in green), and SPLV (Invesco S&P 500 Low Volatility ETF in red).

5. Treasury yields declined sharply over the last two months of the year, following the historically unusual bear steepening from mid-July through the end of October.

Source: www.treasury.gov, Two Centuries Investments

 6. As we repeated throughput 2023, what lies ahead for financial markets will likely be driven by the path and composition of inflation.

The concern about inflation has likely contributed to the bear steepening of the yield curve. Inflation has historically impacted equity valuation multiples. High inflation has led to lower multiples and thus lower investment returns. The composition of inflation will also impact earnings. The last few decades have been a period of low growth in labor costs and low energy costs, both major drivers of rising corporate profit margins.

The headline inflation rate has dropped to about 1% above pre-pandemic levels.

The concern is the “core” inflation rate (excludes food and energy) has proven stickier and remains 2% above pre-pandemic levels.

7. Despite the Federal Reserve raising the federal funds rate by 5% over the last twenty months, real economic growth has not collapsed, though it remains muted.

Real gross domestic product (GDP) and real gross domestic income (GDI) have diverged over the last few quarters. GDP data shows the economy humming along, while GDI data  points to an economic slowdown.

8. The challenge the Federal Reserve faces is how to balance its dual mandate of maximum employment and stable (2% target) inflation.

In the current economic environment. the Federal Reserve cannot achieve its inflation target without risking a significant rise in unemployment and a recession. Because of structural supply shortages, most notably in the labor market, tighter monetary policy is less effective in reducing inflationary pressures. Tighter monetary policy operates by increasing the cost of debt capital and thus, with a lag, puts downward pressure on the demand for goods and services. The dilemma is the Federal Reserve may have to risk crushing real GDP growth (the volume of goods and services being transacted) in order to crush inflationary pressures (price of goods and services being transacted).

While the Federal Reserve Bank of Atlanta data shows wage growth across all industries continues to slow, there are many industries facing supply shortages. Over the last several months, United Airlines, American Airlines, and Southwest Airlines pilots were able to negotiate approximately 40% wage increases over the next four years. UPS union employees negotiated wage increases near 20% over five years and the UAW (United Auto Workers) negotiated 25% general pay increases plus cost-of-living adjustments over the next four years for the Big 3 auto workers.

9. Credit markets remain sanguine despite the Federal Reserve’s actions to tighten monetary policy and the multi-month bear steepening of the yield curve.

At year end 2023. high yield bond spreads had settled around 1.5% below long-term averages and well below recent peaks.

10. Overnight reverse repurchase agreements continue to decline. These agreements have served as a source of financial market liquidity. We are concerned financial market volatility may rise once the amount of these agreements outstanding approaches zero.

December 2023 Market Update: That De-Escalated Quickly

“That escalated quickly” is a phrase uttered by Ron Burgundy in the 2004 movie, Anchorman: The Legend of Ron Burgundy. By “that de-escalated quickly”, we mean the burgeoning U.S. Treasury bond market crisis de-escalted quickly in November.

1. Global equity markets rebounded after three months of declines, boosted by the sharp reversal in U.S. long-term Treasury bond yields.

This chart shows the performance of SPY (SPDR S&P 500 Index ETF in purple), EFA (iShares MSCI EAFE ETF in blue), EEM (iShares MSCI Emerging Markets ETF in orange) and IWM (iShares Russell 2000 ETF in grey), and TLT (iShares 20+ Year Treasury Bond ETF in dashed green).

2. The burgeoning Treasury bond market crisis de-escalated quickly. The bear steepening ceased after three and half months, and long matured Treasury yields declined sharply, approaching the levels of August month end.

Source: www.treasury.gov, Two Centuries Investments

A bear steepening is commonly defined as a double-digit basis point increase in the difference between the 10-year Treasury and 2-year Treasury yield. A bear steepening is a rare occurrence, especially when the yield curve is inverted like it is currently.

The table below from Janus Henderson illustrates the historical rarity.

·       The orange highlighted rows map to bear steepening off inverted yield curves.

·       The blue highlighted rows map to bear steepening off relatively flat curves.

·       The green highlighted rows map to bear steepening off very steep curves.

Our hypothesis remains the bond market was likely communicating a supply digestion concern. We are not certain the supply digestion problem is fully resolved. However, in November the bond market took notice of the continuing moderation of inflation and a downtrend in real economic growth. Odds increased the FOMC will cut the Federal Funds Rate multiple times in 2024.

3. As we keep repeating, what lies ahead for financial markets will likely be driven by the path and composition of inflation.

The concern about inflation has likely contributed to the bear steepening of the yield curve. Inflation has historically impacted equity valuation multiples. High inflation has led to lower multiples and thus lower investment returns. The composition of inflation will also impact earnings. The last few decades have been a period of low growth in labor costs and low energy costs, both major drivers of rising corporate profit margins.

The headline inflation rate has dropped to about 1% above pre-pandemic levels but has risen over the last three months.

The concern is the “core” inflation rate (excludes food and energy) has proven stickier and remains 2% above pre-pandemic levels.

4. Despite the Federal Reserve raising the federal funds rate by 5% over the last eighteen months, real economic growth has not collapsed, though it remains muted.

Real gross domestic product (GDP) and real gross domestic income (GDI) have diverged over the last few quarters. GDP data shows the economy humming along, while GDI data  points to an economic slowdown.

5. The challenge the Federal Reserve faces is how to balance its dual mandate of maximum employment and stable (2% target) inflation.

In the current economic environment. the Federal Reserve cannot achieve its inflation target without risking a significant rise in unemployment and a recession. Because of structural supply shortages, most notably in the labor market, tighter monetary policy is less effective in reducing inflationary pressures. Tighter monetary policy operates by increasing the cost of debt capital and thus, with a lag, puts downward pressure on the demand for goods and services. The dilemma is the Federal Reserve may have to risk crushing real GDP growth (the volume of goods and services being transacted) in order to crush inflationary pressures (price of goods and services being transacted).

While the Federal Reserve Bank of Atlanta data shows wage growth across all industries continues to slow, there are many industries facing supply shortages. Over the last several months, United Airlines and American Airlines pilots were able to negotiate 40% wage increases over the next four years. UPS union employees negotiated wage increases near 20% over five years and the UAW (United Auto Workers) negotiated 25% general pay increases plus cost-of-living adjustments over the next four years for the Big 3 auto workers.

6. Credit markets remain sanguine despite the Federal Reserve’s actions to tighten monetary policy and the multi-month bear steepening of the yield curve.

7. Over the last two months, one of the best performing asset classes has been gold, which traded at all time highs recently and currently sits at over $2,000 per ounce.

This chart shows the performance of SPY (SPDR S&P 500 Index ETF in purple), EFA (iShares MSCI EAFE ETF in blue), EEM (iShares MSCI Emerging Markets ETF in orange) and IWM (iShares Russell 2000 ETF in grey), and GLD (SPDR Gold Trust in dashed gold).

Checking In

It’s been a while since my last blog. I wanted to check in, and review some topics that I’ve covered in the past.

So much has changed in the year and a half since I last wrote. For example, there is now an “AI” button in my blog editing window that is offering to write this blog for me.

At the same time, so many things are “same as ever”. For example, everyone continues see “a lot of uncertainty in the markets” and things continue to look foggy ahead and clear in hindsight.

Uncomfortable IS PROFITABLE

Unlike the generally agreed upon yet not very useful concept of “market uncertainty”, the much less appreciated and more useful concept that also stays the same is that markets (stocks, factors etc.) continue to move in the direction that is most uncomfortable to predict, because the comfortable direction is already priced in.

For example:

  • Last year, it was uncomfortable to predict that inflation will be solved by now.

  • This year, it was uncomfortable to predict that a full recession will be avoided.

In September, I had the honor of speaking on Meb Faber’s podcast, where we discuss this idea in more detail. I gave an example that predicting a market doubling is much less comfortable than market halfling. What is comfortable is already priced in and so it’s only the uncomfortable views (if correct) that make money. That’s why forecasters are famously always wrong - even when they are correct, their forecasts are already priced in.

What’s the most uncomfortable view can you have today? - that’s the one to watch out for.

Long-Run Evidence alleviates ABANDONMENT RISK

On the podcast, we also discussed my latest academic paper on long-run asset allocation where I use almost a century of data (building on top of other long-run work of the past 10 years) for many asset classes and factors. I run a horse race between the popular asset allocation approaches from 60/40 to Risk Parity, Endowment Based, Factor Based and Dynamic Asset Allocation. At this point, it’s not news to anyone paying attention that Dynamic allocation historically crushed the other approaches on drawdown protection in traditional growth recessions.

However in 2022, things were different. Both stocks and bonds suffered a drawdown during inflation driven correction, so Dynamic approach came down as hard as the other approaches, in the 20-30% range. Yet the absolute drawdown was still much better than the max drawdowns of 60/40, which ranges from 30-70%.

STRATEGY timing REDUCES RETURN

Unfortunately, most investors continue to ignore historical evidence of crashes and dry spells of their chosen approaches. That leads them to sell out of their allocations when either of these two risks shows up.

Poor timing contributes to the difference between dollar-weighted returns (the ones investors actually get to earn) and the time-weighted counterparts. Watching my own clients add and remove assets from their accounts based on recent deviations from trend return confirms this human tendency. Sticking with a negative deviation is uncomfortable and yet was the right choice when the underlying source of return is reliable. Remaining invested in reliable approaches continues to be the most prudent answer - albeit much easier said than done.

FactorS BOUNCED BUT ALPHA decayED

Speaking of staying invested, my 2020 blog on why value investors should not give up was well timed. The bounce back from the extreme drawdown gave factor investors a short-term relief. However, my other point stands that the long-term “alpha” in traditional factor investing is likely gone. Because factors were not some "reliable premia” as the academics would have us believe, but were basic anomalies that generated alpha by identifying types of companies that were uncomfortable to hold. Proliferation of quants and smart beta, made these approaches comfortable and unprofitable. As a quant, this is hard to admit (and i have dedicated a lot of time to showing that these factors were real over the long run and not results of datamining). But ironically, it is the contrast of the flat return of last two decades vs the positive return of the prior two centuries, that is the most alarming evidence of factor’s decay.

For anyone who still doubts that factors can get arbitraged away just watch how the top hedge funds manage their capacity. Most of the top funds are closed to new investors and have been closed for a long time. These funds are giving up tens (if not hundreds) of millions of fees by not accepting the easily available additional demand. Something that traditional asset managers would gladly accept. Why do they forgo these easy profits? Because additional AUM would eat into their ability to generate alpha and hence their long-term profits. So if a hedge fund choses to close at 50billion to avoid the risk of alpha decay (where alpha is made up of hundreds of signals), how can traditional factors take in a couple trillion of AUM into a small handful of factors and still maintain their alpha?

  • What’s is the main antidote to alpha decay? - innovation.

  • What’s the main enemy of innovation? - bureaucracy.

ALPHA IN Intangibles

Intangibles are one way to generate innovative alpha as they continue to play a large role in company dynamics. There isn’t a week that goes by, that I don’t see a headline about some company’s culture deterioration causing a crisis or CEO style impacting company culture. These are hard to value assets that are material to the future fundamentals. Just because they are hard to measure, does not mean they are not important. In fact, from the perspective of alpha, this difficulty of measurement makes them even more valuable.

I recently gave a series of talks on intangibles investing at QuantStrats NYC and London, Nuedata, and in this Interactive Brokers webinar that you can watch for free. The webinar is filled with examples of how intangibles can be measured in innovative ways, using language. In one example, I show how we can trace Steve Job’s language in the Apple’s 10Ks. It points to the creative direction in which he took the company when he returned as the CEO in 1998.

Although intangibles investing has proven to be a huge source of alpha over the past two decades, this approach did experience underperformance in 2022. The rise in long-term interest rates affected companies with longer duration assets, which intangibles by definition are.

November 2023 Market Update: The Bond Vigilantes Ride Again

1. The global equity market weakness continued for another month in October, likely triggered by the jump in long maturity U.S. Treasury yields.

This chart shows the performance of SPY (SPDR S&P 500 Index ETF in purple), EFA (iShares MSCI EAFE ETF in blue), EEM (iShares MSCI Emerging Markets ETF in orange) and IWM (iShares Russell 2000 ETF in grey), and TLT (iShares 20+ Year Treasury Bond ETF in dashed red).

2. The U.S. Treasury yield curve continued its bear steepening behavior. Long maturity U.S. Treasury yields jumped, while short maturity U.S. Treasury yields barely moved.

Since the end of August, the ten-year U.S. Treasury note yield has risen 76 basis points, while the two-year U.S. Treasury note yield has risen a paltry 17 basis points, representing a steepening of 59 basis points.

Source: treasury.gov, Two Centuries Investments

A bear steepening is commonly defined as a double-digit basis point increase in the difference between the 10-year Treasury and 2-year Treasury yield. A bear steepening is a rare occurrence, especially when the yield curve is inverted like it is currently.

The table below from Janus Henderson illustrates the historical rarity.

·       The orange highlighted rows map to bear steepening off inverted yield curves.

·       The blue highlighted rows map to bear steepening off relatively flat curves.

·       The green highlighted rows map to bear steepening off very steep curves.

What message could the bond market be communicating?

Are the “bond vigilantes” back, demanding higher yields to protest the Federal Reserve’s policies, as they supposedly did during the early 1980s according to economist Ed Yardeni, who coined the “bond vigilante” phrase?

Are the “bond vigilantes” back like they supposedly were during the 1994 Great Bond Massacre, protesting concerns about federal government spending levels? During the 1994 crisis, Clinton Administration political adviser James Carville referenced the “bond vigilantes” when he said, "I used to think that if there was reincarnation, I wanted to come back as the president or the pope or as a .400 baseball hitter. But now I would like to come back as the bond market. You can intimidate everybody."
We argue the current situation is a straightforward supply and demand issue. The bond market sees ongoing large auctions of Treasury notes and bonds on the horizon, as federal government spending remains at elevated relative to a few years ago, federal tax revenues have been in decline since the end of 2022, and the U.S. Treasury Department shifts away from its reliance on Treasury bill issuance. There will be a jump in the supply of longer maturity notes and bonds.

What about buyers, i.e., demand, for the increased supply? Most importantly, the Federal Reserve ended its Quantitative Easing program and is reducing the size of its balance sheet. It was a big buyer of Treasuries, and a price insensitive one at that. China and Japan have curtailed their purchases of Treasuries, whether for geo-political or domestic reasons. U.S. banks already have too much interest rate duration as the regional bank crisis highlighted in March 2023. Defined benefit pension funds and traditional life insurers, once large natural buyers of long maturity Treasuries, are in decline.

Price sensitive buyers realized they can garner more income on Treasury bills and short-term Treasury notes than longer maturity Treasury notes and bonds. A 5+% rate also feels good after years of near zero short term rates. Yes, cash equivalents pose reinvestment risk, but the other side of the coin is assuming considerable duration risk when inflation is not yet back to its low and stable pre-pandemic levels.

In summary, the bond market is likely communicating a supply digestion concern, The problem is higher long maturity interest rates at this stage of the economic cycle create tighter financial conditions, especially for the housing market which is largely financed by fifteen-year and thirty-year mortgage loans. Home construction and renovation have been large contributors to economic growth. In summary, the incremental tightening of financial conditions reduces the probability of a soft landing for the economy.

3. As we keep repeating, what lies ahead for financial markets will likely be driven by the path and composition of inflation.

The concern about inflation has likely contributed to the bear steepening of the yield curve and the tighter financial conditions. Inflation has historically impacted equity valuation multiples. High inflation has led to lower multiples and thus lower investment returns. The composition of inflation will also impact earnings. The last few decades have been a period of low growth in labor costs and low energy costs, both major drivers of rising corporate profit margins.

The headline inflation rate has dropped to about 1% above pre-pandemic levels but has risen over the last three months.

The concern is the “core” inflation rate (excludes food and energy) has proven stickier and remains 2% above pre-pandemic levels. If not for the ongoing bear steepening of the yield curve, the sticky core inflation rate might compel the Federal Reserve to keep raising short term interest rates in an attempt to dampen economic demand and push inflation back towards its 2% target.

4. Despite the Federal Reserve raising the federal funds rate by 5% over the last eighteen months, real economic growth has not collapsed, though it remains muted.

Real gross domestic product (GDP) and real gross domestic income (GDI) have diverged over the last few quarters. GDP data shows the economy humming along, while GDI data  points to an economic slowdown.

5. The challenge the Federal Reserve faces is how to balance its dual mandate of maximum employment and stable (2% target) inflation.

In the current economic environment. the Federal Reserve cannot achieve its inflation target without risking a significant rise in unemployment and a recession. Because of structural supply shortages, most notably in the labor market, tighter monetary policy is less effective in reducing inflationary pressures. Tighter monetary policy operates by increasing the cost of debt capital and thus, with a lag, puts downward pressure on the demand for goods and services. The dilemma is the Federal Reserve may have to risk crushing real GDP growth (the volume of goods and services being transacted) in order to crush inflationary pressures (price of goods and services being transacted).

While the Federal Reserve Bank of Atlanta data shows wage growth across all industries continues to slow, there are many industries facing supply shortages. Recently, United Airlines and American Airlines pilots were able to negotiate 40% wage increases over the next four years. UPS union employees negotiated wage increases near 20% over five years and the UAW (United Auto Workers) negotiated 25% general pay increases plus cost-of-living adjustments over the next four years for the Big 3 auto workers.

6. The S&P 500 Index may achieve year-over-year earnings growth, an outcome last seen in the third quarter of 2022.

With 81% of the companies in the index having provide quarterly earnings reports, the earnings growth rate is tracking at 3.7% year-over-year, while the revenue growth rate is 2.3%.

7. Credit markets remain sanguine despite the Federal Reserve’s actions to tighten monetary policy and the recent bear steepening.

High yield bond spreads remain near long term averages and below recent peaks.

October 2023 Market Update: The Unholy Trinity Surfaces

1. The global equity market weakness continued in September.

This chart shows the performance of SPY (SPDR S&P 500 Index ETF in purple), EFA (iShares MSCI EAFE ETF in blue), EEM (iShares MSCI Emerging Markets ETF in orange) and IWM (iShares Russell 2000 ETF in grey).

2. The unholy trinity of rising oil prices, increasing U.S. interest rates, and a strengthening U.S. dollar is pressuring asset prices.

Since July 13, crude oil prices have risen approximately $12 per barrel (14% price increase), the U.S. dollar has risen approximately 7%, and the ten-year U.S. Treasury note yield has risen 83 basis points. In a world accustomed to low-cost energy, dependent on a cheap reserve currency for facilitating global trade, and addicted to low interest rates for financing, simultaneous increases in the levels of these three financial variables is a threat to global economic activity and asset prices. Stocks, bonds, and gold have responded negatively to the rise of the unholy trinity.

This chart shows the performance of SPY (SPDR S&P 500 Index ETF in purple), EFA (iShares MSCI EAFE ETF in blue), EEM (iShares MSCI Emerging Markets ETF in orange), WM (iShares Russell 2000 ETF in grey), GLD (SPDR Gold Trust in yellow), TLT (iShares 20 Plus Year Treasury Bond ETF in red), CO1 (Brent crude oil futures contract in black), TBX (ProShares Short 7-10 Year Treasury ETF in light blue), and DXY (U.S. Dollar Index in green).

3. What lies ahead for financial markets will likely be driven by the path and composition of inflation.

The level of inflation has historically impacted equity valuation multiples. High inflation has led to lower multiples and thus lower investment returns. The composition of inflation will also impact earnings. The last few decades have been a period of low growth in labor costs and low energy costs, both major drivers of rising corporate profit margins.

The headline inflation rate has dropped to about 1% above pre-pandemic levels but has risen the last two months.

The concern is the “core” inflation rate (excludes food and energy) has proven stickier and remains 2.5% above pre-pandemic levels. A sticky core inflation rate might compel the Federal Reserve to keep raising short term interest rates in an attempt to dampen economic demand and push inflation back towards its 2% target. More tightening of monetary policy risks a severe economic downturn.

4. Despite the Federal Reserve raising the federal funds rate by 5% over the last eighteen months, real economic growth has not collapsed, though it remains muted.

Real gross domestic product (GDP) and real gross domestic income (GDI) have diverged over the last few quarters. GDP data shows the economy humming along, while GDI data  points to an economic slowdown.

The Atlanta Federal Reserve Bank’s GDP Now estimate of 4.9% real economic growth for the third quarter 2023 lends credence to the view that GDI will rise to close the gap to GDP.

5. The challenge the Federal Reserve faces is how to balance its dual mandate of maximum employment and stable (2% target) inflation.

In the current economic environment. the Federal Reserve cannot achieve its inflation target without risking a significant rise in unemployment and a recession. Because of structural supply shortages, most notably in the labor market, tighter monetary policy is less effective in reducing inflationary pressures. Tighter monetary policy operates by increasing the cost of debt capital and thus, with a lag, puts downward pressure on the demand for goods and services. The dilemma is the Federal Reserve may have to risk crushing real GDP growth (the volume of goods and services being transacted) in order to crush inflationary pressures (price of goods and services being transacted).

While the Federal Reserve Bank of Atlanta data shows wage growth across all industries continues to slow, there are many industries facing supply shortages. Recently, United Airlines and American Airlines pilots were able to negotiate 40% wage increases over the next four years. UPS union employees negotiated wage increases near 20% over five years. Currently, the UAW (United Auto Workers) is demanding a 46% pay deal and FedEx pilots are demanding a 30% pay rise.

The unemployment rate remains nears its lows over the last four decades.

6. Credit markets remain sanguine despite the Federal Reserve’s actions to tighten monetary policy.

High yield bond spreads remain near long-term averages, and 2% below the most recent peak of 6% in July 2022.

September 2023 Market Update: Inflation Remains Sticky

1. The global equity market rally stalled in August.

This chart shows the performance of SPY (SPDR S&P 500 Index ETF in purple), EFA (iShares MSCI EAFE ETF in blue), EEM (iShares MSCI Emerging Markets ETF in orange) and IWM (iShares Russell 2000 ETF in grey).

2. What lies ahead for financial markets will likely be driven by the path and composition of inflation.

The level of inflation has historically impacted equity valuation multiples. High inflation has led to lower multiples and thus lower investment returns. The composition of inflation will also impact earnings. The last few decades have been a period of low growth in labor costs and low energy costs, both major drivers of rising corporate profit margins.

The headline inflation rate has dropped to about 1% above pre-pandemic levels as food and energy costs have declined.

This chart shows the price of a barrel of WTI crude oil (source: CNBC).

Energy costs appear to have bottomed as crude oil prices have risen $18 per barrel over the last two months, making further declines in headline inflation dependent on the trend in services inflation.

The concern is the “core” inflation rate (excludes food and energy) has proven stickier and almost 3% above pre-pandemic levels.

3. Despite the Federal Reserve raising the federal funds rate by 5% over the last seventeen months, real economic growth has not collapsed, though it remains muted.

Real gross domestic product (GDP) and real gross domestic income (GDI) have diverged over the last few quarters. GDP data shows the economy humming along, while GDI data points to an economic slowdown.

The Atlanta Federal Reserve Bank’s GDP Now estimate of 5.6% real economic growth for the third quarter 2023 lends credence to the view that GDI will rise to close the gap to GDP.

4. The challenge the Federal Reserve faces is how to balance its dual mandate of maximum employment and stable (2% target) inflation.

In the current economic environment. the Federal Reserve cannot achieve its inflation target without risking a significant rise in unemployment and a recession. Because of structural supply shortages, most notably in the labor market, tighter monetary policy is less effective in reducing inflationary pressures. Tighter monetary policy operates by increasing the cost of debt capital and thus, with a lag, puts downward pressure on the demand for goods and services. The dilemma is the Federal Reserve may have to risk crushing real GDP growth (the volume of goods and services being transacted) in order to crush inflationary pressures (price of goods and services being transacted).

While the Federal Reserve Bank of Atlanta data shows wage growth across all industries continues to slow, there are many industries facing supply shortages. Recently, United Airlines and American Airlines pilots were able to negotiate 40% wage increases over the next four years. Currently, the UAW (United Auto Workers) is demanding a 46% pay deal and FedEx pilots are demanding a 30% pay rise.

The unemployment rate remains nears its lows over the last four decades.

5. Credit markets remain sanguine despite the Federal Reserve’s actions to tighten monetary policy.

High yield bond spreads remain near long-term averages, and 2% below the most recent peak of 6% in July 2022.

August 2023 Market Update

1. July was the second consecutive strong month for global equity markets.

This chart shows the performance of SPY (SPDR S&P 500 Index ETF in purple), EFA (iShares MSCI EAFE ETF in blue), EEM (iShares MSCI Emerging Markets ETF in orange) and IWM (iShares Russell 2000 ETF in dark grey).

U.S. small-cap stocks were the star performers for the second consecutive month.

2. While the year-to-date outperformance of U.S. large cap equities remains intact, U.S. small cap and emerging markets equities have closed the gap over the last two months.

This chart shows the performance of SPY (SPDR S&P 500 Index ETF in purple), EFA (iShares MSCI EAFE ETF in blue), EEM (iShares MSCI Emerging Markets ETF in orange) and IWM (iShares Russell 2000 ETF in dark grey).

We would not be surprised if U.S. small cap, non-US developed markets and emerging markets equities continue to outperform U.S. large cap equities. Over the last five years, U.S. large cap has outperformed both U.S. small cap and non-US developed markets by around 50% and has outperformed emerging markets by over 70%.

3. What lies ahead for financial markets will likely be driven by the path and composition of inflation.

The level of inflation has historically impacted equity valuation multiples. High inflation has led to lower multiples and thus lower investment returns. The composition of inflation will also impact earnings. The last few decades have been a period of low growth in labor costs and low energy costs, both major drivers of rising corporate profit margins.

The headline inflation rate is now only 1% above pre-pandemic levels.

The concern is the “core” inflation rate (excludes food and energy) has proven stickier and remains almost 3% above pre-pandemic levels.

4. Despite the Federal Reserve raising the federal funds rate by 5% over the last sixteen months, real economic growth has not collapsed, though it remains muted.

According to the "advance" estimate from the U.S. Bureau of Economic Analysis, real gross domestic product (GDP) even picked up from its recent trend, increasing at an annual rate of 2.4% in the second quarter of 2023.

Real gross domestic income (GDI) data for the second quarter is not yet available. The GDI data diverged from the GDP data in first quarter and pointed to an economic slowdown. These data series will converge, the question is in which direction.

5. The challenge the Federal Reserve faces is how to balance its dual mandate of maximum employment and stable (2% target) inflation.

In the current economic environment. the Federal Reserve cannot achieve its inflation target without risking a significant rise in unemployment and a recession. Because of structural supply shortages, most notably in the labor market, tighter monetary policy is less effective in reducing inflationary pressures. Tighter monetary policy operates by increasing the cost of debt capital and thus, with a lag, puts downward pressure on the demand for goods and services. The dilemma is the Federal Reserve may have to risk crushing real GDP growth (the volume of goods and services being transacted) in order to crush inflationary pressures (price of goods and services being transacted).

While the Federal Reserve Bank of Atlanta data shows wage growth across all industries continues to slow, there are many industries facing supply shortages. Recently, United Airlines and American Airlines pilots were able to negotiate 40% wage increases over the next four years. Currently, the UAW (United Auto Workers) is demanding a 46% pay increase deal and FedEx pilots are demanding a 30% pay rise.

Adding to the challenge facing the Federal Reserve is the demand for mortgage loans is contracting at a much slower pace. The rapid rise in mortgage rates in 2022 crushed mortgage loan issuance and appeared to be putting the brakes on housing construction. As housing construction remains an important driver of economic activity, any sustained strength in construction activity will contribute to inflationary pressure.

Lastly, crude oil prices have risen recently. Continued strength in oil prices will put upward pressure on headline inflation, potentially make core inflation stickier, and further complicate the Federal Reserve’s balancing act.

6. Corporate earnings growth in the second quarter 2023, while better than expected, was still the weakest growth in almost three years.

With 84% of the companies in the S&P 500 Index having reported quarterly earnings, earnings declined 5.2% and revenues declined 0.6%, year over year.

7. While most of the world is dealing with inflationary pressures and many central banks are still raising short-term interest rates, in contrast China is facing the risk of a credit crisis and deflation.

This chart shows the People’s Bank of China one-year medium term funding rate versus the U.S. Federal Reserve’s federal funds rate (overnight rate)

China’s central bank, the PBoC, once again cut its one-year medium-term lending facility (MLF) rate, to 2.50% on August 15th, as it seeks to support economic growth weighed down by a deepening property crisis and muted consumer spending.

Country Garden, a real estate developer with $194 billion in liabilities at year end 2022, missed payments of $22.5 million on two of its offshore dollar bonds. Trading in eleven of its onshore bonds was suspended. A default appears to be a foregone conclusion.

China Evergrande, once China’s largest property developer by sales, filed for Chapter 15 bankruptcy in New York on August 17. Its meltdown began in September 2021 and triggered a chain of failures across the Chinese property sector, which is estimated to represent as high as 30% of China’s GDP. We discussed Evergrande in our December update (December 2021 Market Update).

How the Chinese government navigates the real estate crisis bears monitoring for two reasons.

  • The Chinese economy is a significant source of demand for commodities.

  • Any large depreciation of China’s currency, the renminbi, could have a large impact on global trade and financial flows.

July 2023 Market Update: Strong Equity Rebound Continues...What Lies Ahead?

1. June was a strong month for the U.S. equity market.

This chart shows the performance of SPY (SPDR S&P 500 Index ETF in purple), EFA (iShares MSCI EAFE ETF in blue), EEM (iShares MSCI Emerging Markets ETF in orange) and IWM (iShares Russell 2000 ETF in green).

In June, U.S. equity markets outperformed non-US equity markets. U.S. small cap stocks outperformed U.S. large cap stocks after lagging their larger cap peers since the regional bank crisis in March.

2. Year-to-date trends remain intact, with large cap U.S. equities leading the way and emerging market equities as the laggard, dragged down by China.

This chart shows the performance of SPY (SPDR S&P 500 Index ETF in purple), EFA (iShares MSCI EAFE ETF in blue), EEM (iShares MSCI Emerging Markets ETF in orange) and IWM (iShares Russell 2000 ETF in green).

3. The powerful rally in U.S. growth stocks has propelled the U.S. equity market.

This chart shows the performance of SPY (SPDR S&P 500 Index ETF in purple), IWF (iShares Russell 1000 Growth ETF in blue), IWD (iShares Russell 1000 Value ETF in orange).

Year-to-date, U.S. large cap growth stock universe has generated a 30% return.

4. Year-to-date, other asset classes have provided modest returns.

This chart shows the performance of SPY (SPDR S&P 500 Index ETF in purple), IWM (iShares Russell 2000 ETF in green), HYG (iShares iBoxx USD High Yield Corporate Bond ETF in blue), GLD (SPDR Gold Trust ETF in yellow), and TLT (iShares 20+ Year Treasury Bond ETF in orange).

5. An examination of performance over the last 18 months is a sober reminder financial markets have not fully recovered from the carnage of the first nine months of 2022.

This chart shows the performance of SPY (SPDR S&P 500 Index ETF in purple), IWM (iShares Russell 2000 ETF in green), HYG (iShares iBoxx USD High Yield Corporate Bond ETF in blue), GLD (SPDR Gold Trust ETF in yellow), aTLT (iShares 20+ Year Treasury Bond ETF in orange), IWF (iShares Russell 1000 Growth ETF in red), IWD (iShares Russell 1000 Value ETF in gray).

6. What lies ahead for financial markets will be likely be driven by the path and composition of inflation.

The level of inflation has historically impacted equity valuation multiples. High inflation (and deflation) has led to lower multiples and thus lower investment returns. The composition of inflation will also impact earnings. The last few decades have been a period of low growth in labor costs, thus boosting corporate profit margins.

Producer prices have already declined back to pre-pandemic levels.

Consumer prices have continued to decline but remain around 2% above pre-pandemic levels.

Wage growth remains strong in many segments of the labor market. The stickiness of higher wage growth remains a headwind to profit margins.

7. Global trade volumes are declining and manufacturing surveys point ot continued weakness.

Source: John Kemp (Reuters)

8. Corporate earnings reports for the second quarter are just around the corner. The results and management commentary will provide some clarity on the economic outlook, now that the pandemic related distortion of economic collapse / economic surge / economic normalization is entering the rear view mirror.

The results from early reporter FedEx Corp. (ticker: FDX) were not reassuring. All three FedEx segments (Express, Ground, Freight) experienced volume declines and management is forecasting “flat to low-single-digit-percent revenue growth year over year” for fiscal year 2024.

9. While manufacturing and global trade exhibit sustained weakness, consumer spending on services and most of the service sector have chugged along.

What could disrupt this consumer momentum, outside of the obvious job losses, which is a lagging indicator?

(1) Refinancing risk for loans, especially mortgages, either in the form of higher interest rates (compared to 2021) and tighter bank lending standards, likely driven by the aftershocks of the March 2023 regional bank crisis.

Source: treasury.gov, Two Centuries Investments

(2) Higher energy prices, namely higher crude oil prices.

Source: John Kemp (Reuters)

Crude oil prices remain well below the recent 2022 peak.

June 2023 Market Update: Large Liquid Mega Caps, Large Language Models, and Long Lag Monetary Policy

1. On the surface, May was a quiet month for U.S. financial markets.

This chart shows the price performance of SPY (SPDR S&P 500 Index ETF in purple), TLT (iShares 20 Plus Year Treasury Bond ETF in green), LQD (iShares iBoxx $ Investment Grade Corporate Bond ETF in red), HYG (iShares iBoxx $ High Yield Corporate Bond ETF in orange), IWM (iShares Russell 2000 Index in blue), and GLD (SPDR Gold Trust in yellow).

U.S. large cap equities, US small cap equities, U.S. high yield debt, U.S. investment grade debt, long maturity U.S. Treasury bonds, and gold all generated returns in a narrow band between +1% and -1% in the month of May.

2. However there was considerable dispersion within the U.S. equity markets.

This chart shows the price performance of IWF (iShares Russell 1000 Growth ETF in purple), SPY (SPDR S&P 500 Index ETF in yellow), RSP (Invesco S&P 500 Equal Weight ETF in green), IWD (iShares Russell 1000 Value ETF in blue), and SPYD (SPDR Portfolio S&P 500 High Dividend ETF in orange).

Growth stocks outperformed value stocks by more than 8%. The market cap weighted S&P 500 Index outperformed an equally weighted index of S&P 500 constituents by more than 4%. High dividend stocks were the worst performing style (factor), underperforming the S&P 500 by over 8% and underperforming growth stocks by over 12%.

This chart shows the price performance of IWF (iShares Russell 1000 Growth ETF in purple), SPY (SPDR S&P 500 Index ETF in yellow), RSP (Invesco S&P 500 Equal Weight ETF in green), IWD (iShares Russell 1000 Value ETF in blue), and SPYD (SPDR Portfolio S&P 500 High Dividend ETF in orange).

The year-to-date performance dispersion is even more stark. Growth stocks have outperformed high dividend stocks by an astounding 32%.

3. Large liquid mega cap stocks remain the standout performers.

This chart shows the returns for the following stocks. NVDA = NVIDIA Corporation; META = Meta Platforms, Inc.; TSLA = Tesla Inc.; AAPL = Apple Inc.; AMZN = Amazon.com, Inc.; GOOGL = Alphabet Inc.; MSFT = Microsoft Corp.

These seven mega cap stocks were under performers for most of 2022. All are also considered beneficiaries of trend towards Artificial Intelligence, the most well known applications being autonomous driving systems and ChatGPT with its large language model.

4. The Artificial Intelligence business opportunity has also been a tailwind for certain computer hardwire providers, including some semiconductor stocks.

This chart shows the returns for the following stocks. NVDA = NVIDIA Corporation; AMD = Advanced Micro Devices, Inc.; SMCI = Super Micro Computer Inc.

5. U.S. equity market valuations look expensive at current levels of economic growth and inflation.

Source: Yardeni Research

6. Real economic activity has remained muted over the last four quarters.

This chart shows the year over year change in real gross domestic product.

The good news is the much ballyhooed recession has not materialized. The concern is real economic activity below a 2% growth rate will not translate to the strong corporate revenue growth needed to offset profit margin pressure, especially with no economic growth tailwinds from China and Europe.

7. Producer prices have already declined back to pre-pandemic levels. Consumer prices have remained stickier and well above pre-pandemic levels. Wage growth remains strong in many segments of the labor market.

A continued decline in inflation will ease the pressure on corporate profit margins. However, lower wages represent a trade-off, namely lower consumer spending but lower costs for companies.

8. The boom in federal government spending is behind us.

The pandemic related federal government spending boom supported corporate profit margins and likely delayed the full impact of monetary policy tightening on the economy.

9. Commercial banks are tightening credit standard for loans. The tightening started before the bank crisis in March and has picked up steam since then.

Tightening credit standards for loans is a lagged impact of tighter monetary policy. It will be a headwind for economic growth.

10. What happens going forward for both the economy and financial markets will depend on the continued emergence of the “long and variable lags” of monetary policy. The fog is starting to lift.