1. U.S. small cap stocks rocketed higher in July. Year-to-date, U.S. large cap stocks continue to outperform.

This chart shows the performance of SPY (SPDR S&P 500 Index ETF in purple), EFA (iShares MSCI EAFE ETF in blue), EEM (iShares MSCI Emerging Markets ETF in orange), and IWM (iShares Russell 2000 ETF in grey).

This chart shows the performance of SPY (SPDR S&P 500 Index ETF in purple), EFA (iShares MSCI EAFE ETF in blue), EEM (iShares MSCI Emerging Markets ETF in orange), and IWM (iShares Russell 2000 ETF in grey).
2. Below the surface, investors rotated away from momentum and growth stocks, which were the big winners over the last twelve months. Dividend payers and value stocks outperformed.

Source: S&P Dow Jones Indices

Source: S&P Dow Jones Indices
The question is whether the market rotation away from momentum and growth stocks, especially the so-called Magnificent Seven mega cap stocks, represents a broadening of market strength or is the proverbial canary in the coal mine. Equity market performance in the first several days of August hints at burgeoning equity market weakness after a twenty-one month surge in stock prices.
3. Gold continues to glitter, with no loss of price momentum.

This chart shows the performance of SPY (SPDR S&P 500 Index ETF in blue), GLD (SPDR Gold Trust in yellow), DXY (U.S. Dollar Index in green), and IEF (iShares 7-10 Year Treasury Bond ETF in purple).
Gold typically underperforms in periods of U.S. Dollar strength, when inflation is declining, and when long-term interest rates are rising. All three circumstances have occurred this year and yet gold has outperformed. The reason is clear. Strong demand for gold has emanated from the east, with The Central Bank of the People's Republic of China being the biggest buyer.
4. Inflationary pressures are starting to ease. Inflation remains a headwind for investors seeking high real returns (real return = nominal return - rate of inflation).

In the U.S., the headline inflation rate had plateaued over 1% above pre-pandemic levels. In the last three months it has started to creep down.

The “core” inflation rate (excludes food and energy) has continued to creep down but also remains over 1% above pre-pandemic levels.

Due to sticky inflation, the FOMC has kept the effective federal funds rate at 5.33% for the past year.
We discussed the inflation challenge in more detail in April’s market update.
5. Despite sticky inflation and no rate cuts by the FOMC, U.S. financial conditions remain loose and U.S. credit markets remain sanguine.

Over the last few months, the Chicago Fed’s National Financial Conditions Index has been signaling looser financial conditions, suggesting monetary policy is not restrictive despite 525 basis points of federal funds rate increases over the last two years.
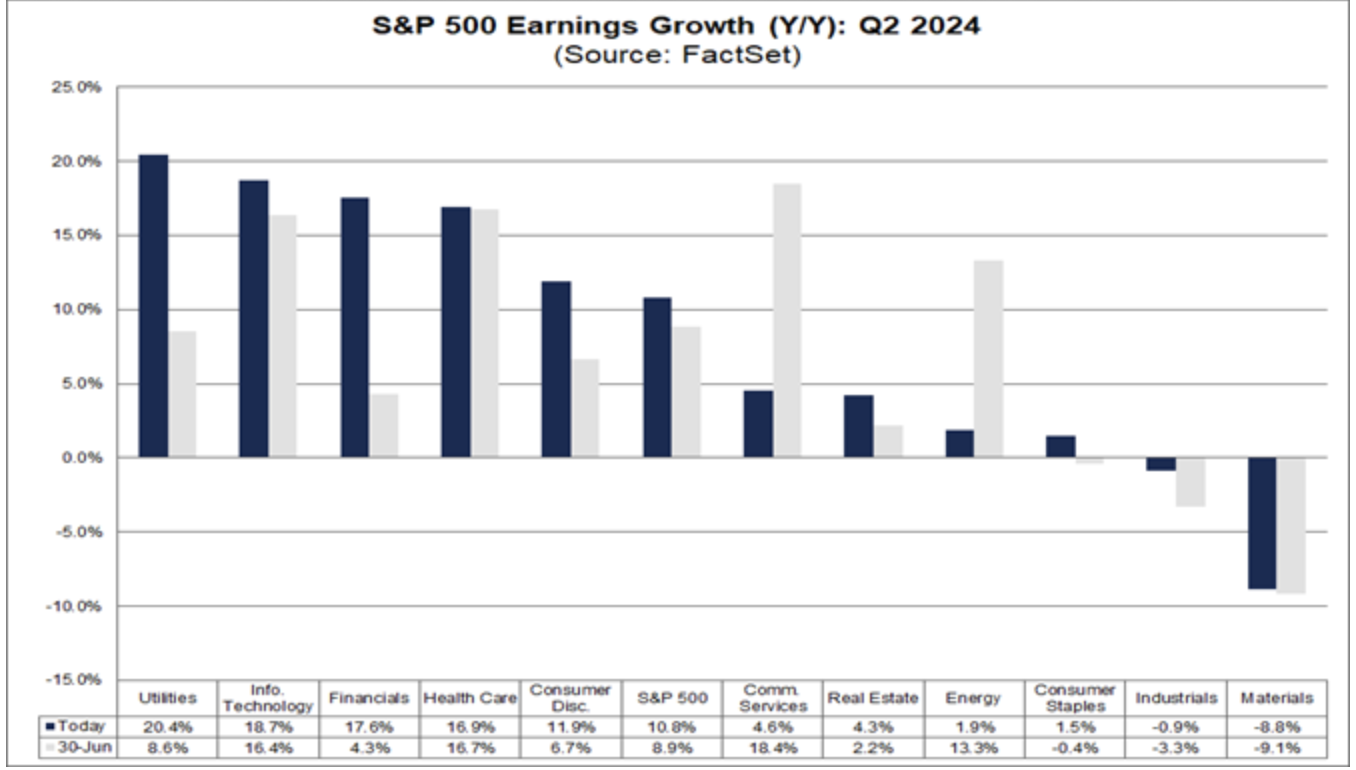
6. Corporate earnings are on pace to increase almost 11% year-over-year in the second quarter, the best growth rate since 4q 2021.