Market Insights

March 2023 Market Update: Waiting Patiently

The title says it all. We are waiting patiently for more data, especially inflation data. Inflation has peaked, but its rate of decline has slowed, and where it settles is what matters most.

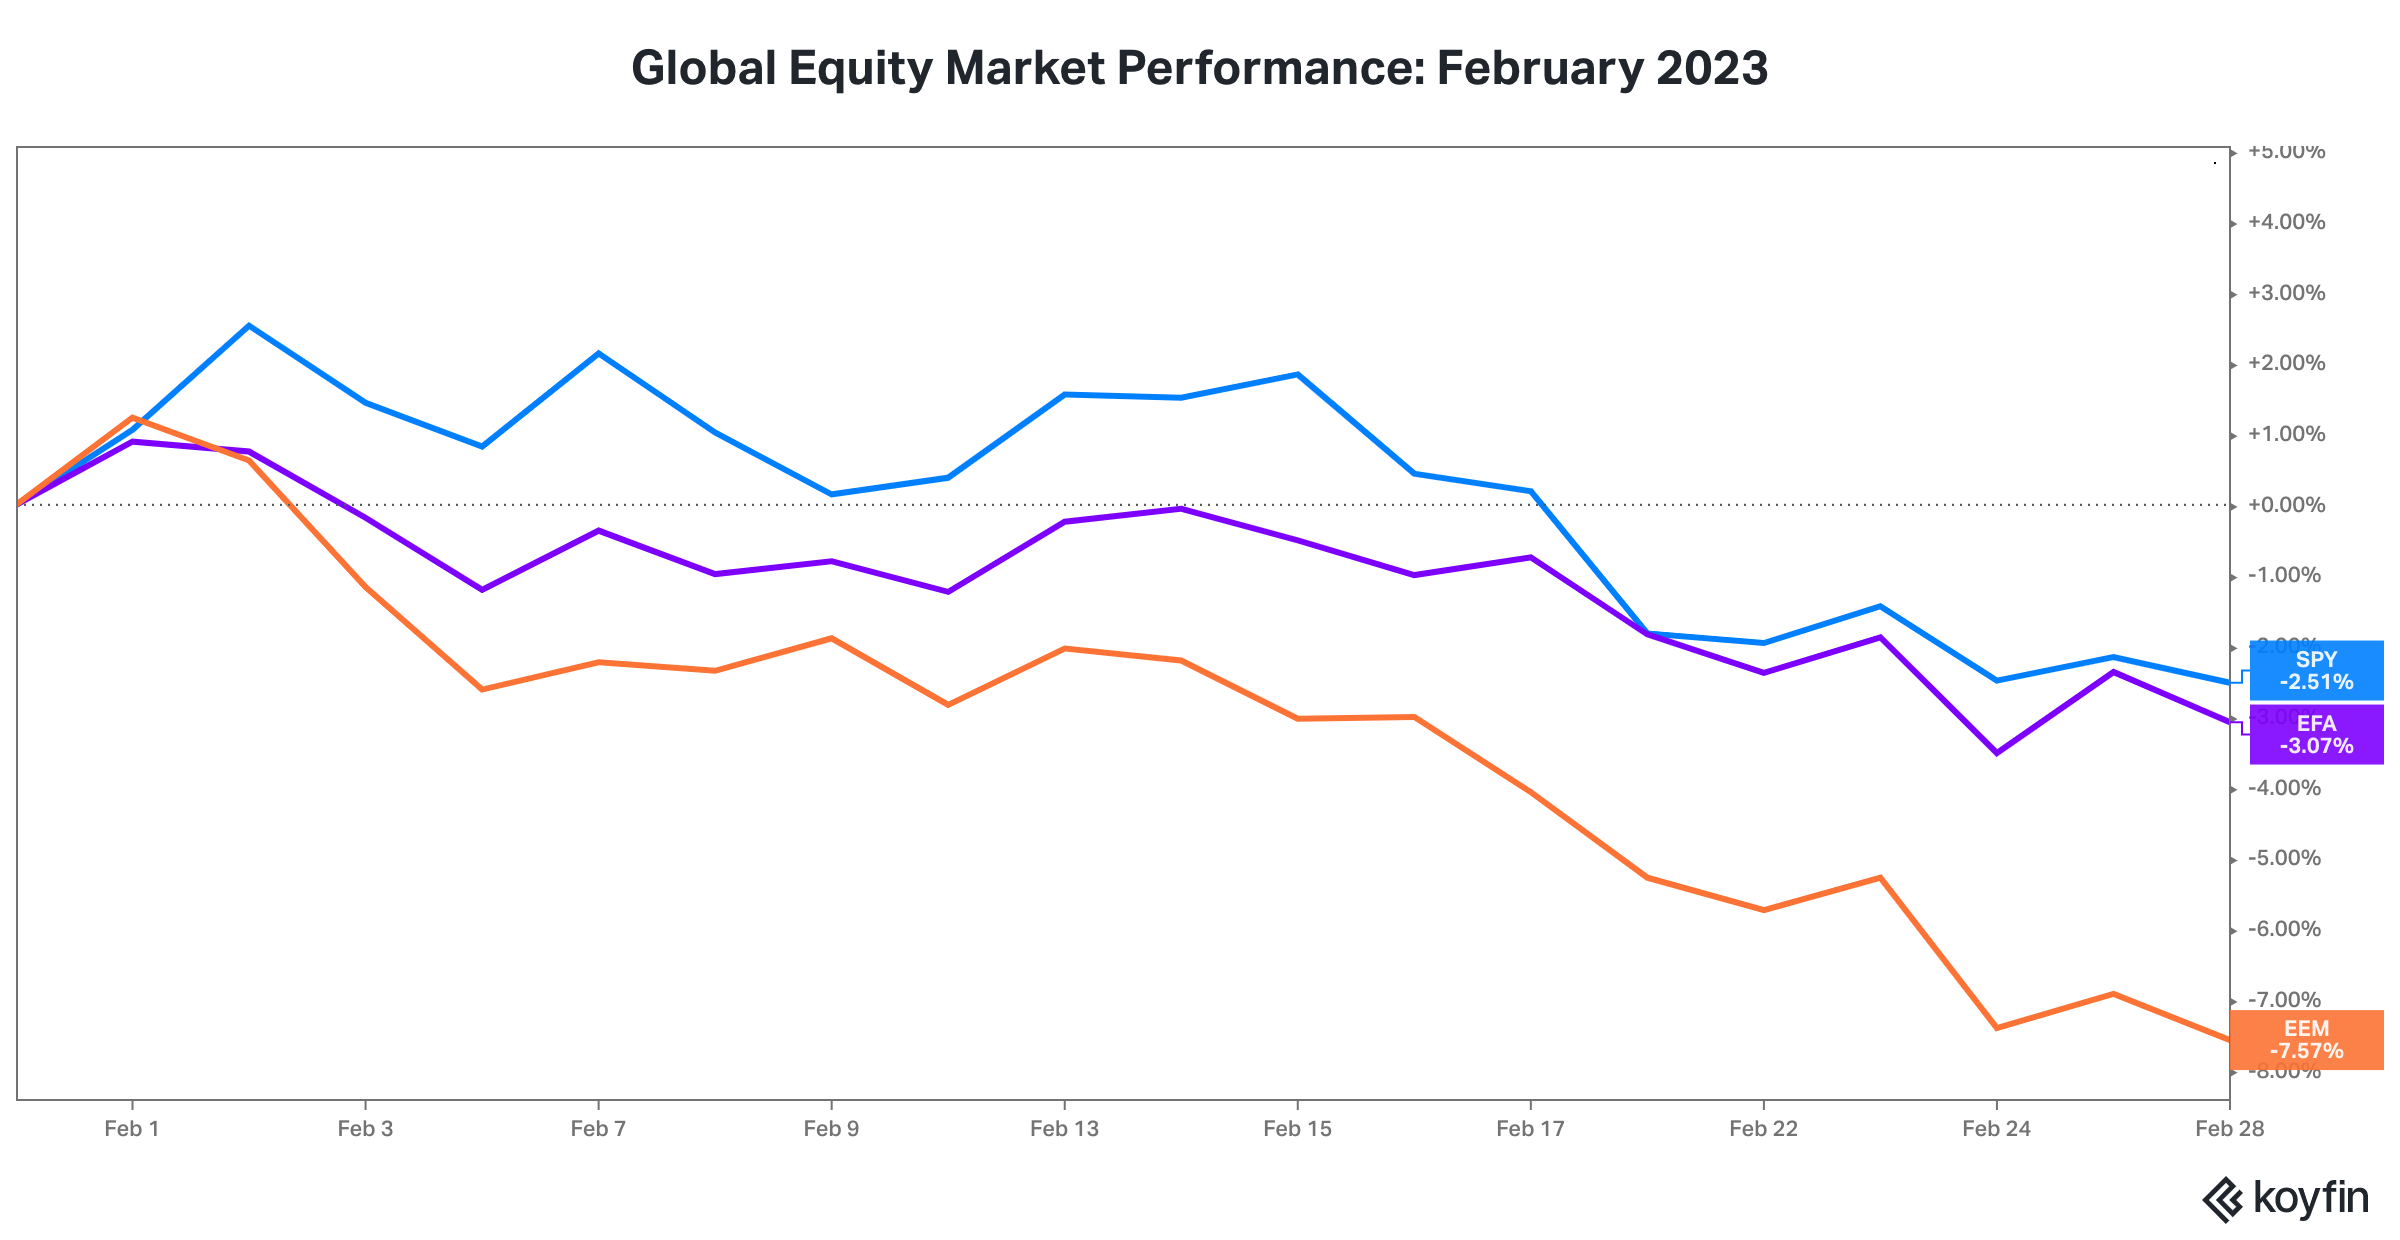
1. February was a weak though uneventful month for global equity markets.

This chart shows the price performance of SPY (SPDR S&P 500 Index ETF in blue), EFA (iShares MSCI EAFE ETF in purple), and EEM (iShares MSCI Emerging Markets ETF in orange).

2. Corporate earnings season confirmed businesses are still dealing with cost pressures.

With 99% of S&P 500 companies having reported earnings, year over year revenue growth was solid 6.3%. However, earnings declined 4.6%. Profit margins declined in eight of the eleven sectors. The energy, industrials, and real estate sectors were the three exceptions.

3. The tightness in many segments of the labor market will continue to be a headwind for profit margins. Our bigger concern is the Federal Reserve’s reaction function if inflation remains sticky above a 4% level.

On March 1, Minneapolis Federal Reserve Bank President Neel Kashkari commented, "I think my colleagues agree with me that the risk of undertightening is greater than the risk of overtightening”.

If the Federal Reserve resumes more aggressive monetary tightening, the risk of a policy error will jump and a recession in the near term will be the likely economic outcome.

February 2023 Market Update: Stranger Things (in the U.S. Equity Market)

1. The composition of the U.S. equity market performance in January qualifies as one of the stranger things I have seen in my career.

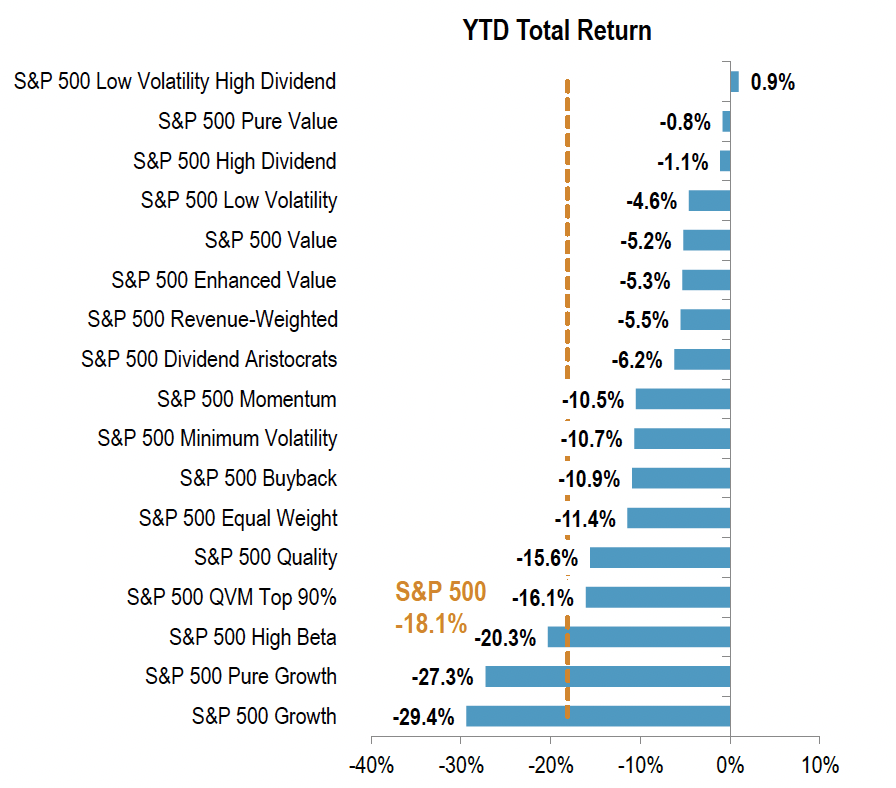
In January, the U.S. equity market market rose 6.3% (as proxied by the S&P 500 Index). I wasn’t surprised risk assets started the year with a strong upward bounce as the U.S. equity market declined 18.1% in 2022. Nor was I surprised high beta stocks outperformed low volatility stocks after underperforming low volatility stocks by 15.7% in 2022, though the degree of outperformance, by 19.3%, was a bit surprising. Some mean reversion was likely for both the market overall and for underlying equity factors. Risk on.

What was “Upside Down”, given the aforementioned mean reversion in both the overall market and high beta vs. low volatility, was the lack of mean reversion in the performance of growth stocks vs. value stocks. Growth underperformed Value by 1.4% in January after underperforming by 24.2% in 2022. Pure Growth did even worse on a relative basis, underperforming Pure Value by 7.9%.

Source: S&P Dow Jones Indices LLC. This chart shows equity factor performance in January 2023, using the S&P DJI factor methodology.

Source: S&P Dow Jones Indices LLC. This chart shows equity factor performance for the calendar year 2022, using the S&P DJI factor methodology.

Even stranger was the growth vs. value performance when considering history. Value stocks typically underperform growth stocks in risk on markets. January 2023 was definitely an anomaly, especially for pure value vs. pure growth. A supernatural force at work?

Source: S&P Dow Jones Indices LLC.

2. January was a banner month for all major asset classes.

This chart shows the price performance of SPY (SPDR S&P 500 Index ETF in purple), EFA (iShares MSCI EAFE ETF in blue), EEM (iShares MSCI Emerging Markets ETF in orange), GLD (SPDR Gold Trust ETF in dotted yellow), HYG (iShares iBoxx USD High Yield Corporate Bond ETF in dashed light blue), TLT (iShares 20+ Year Treasury Bond ETF in dashed light blue) and IEF (iShares 7-10 Year Treasury Bond ETF in dashed red.)

3. Inflation as measured by CPI-U may be moderating, but businesses are still dealing with cost pressures that have resulted in earnings declines despite revenue growth.

With 50% of S&P 500 companies having reported earnings as of February 3, year over year revenue growth is estimated to be a modest 4.3%. However, earnings are estimated to decline 5.3%. Only the energy, industrials, and real estate sectors are showing both revenue growth and earnings growth.

4. The paths forward for the U.S. equity market and the U.S. economy remain encased in heavy fog, a view introduced in last month in our 2023 year ahend outlook commentary.

From my perspective, the two debt market charts below encapsulate the divergent messages being sent to investors.

The Treasury yield curve remains inverted, and is even more inverted than it was at year end. Interest rates, via the inverted yield curve, are signaling economic weakness and maybe even deflationary pressure is on the horizon.

Source: treasury.gov, Two Centuries Investments

On the other hand, the credit markets remain sanguine. High yield credit spreads fell 51 basis points in January, are 120 basis points below their most recent peak at the end of September, and are 169 basis points below their 2022 peak in early July.

Credit markets are signaling the U.S. economy is weathering the large and rapid tightening of monetary policy.

If credit markets are correct, the question will become at what level inflation settles. If the level is too high, the Federal Reserve will likely be forced to resume more aggressive monetary tightening. The risk of a policy error and an ensuing recession would become likely.

At this stage, we are monitoring for economic and financial market data for clues.

January 2023 Market Update & Year Ahead Outlook: Credit Risk Takes the Wheel

1. Inflation risk and interest rate risk drove financial market performance in 2022, not just for bonds, but also for stocks.

In its November 3, 2021 statement, the FOMC asserted “…Inflation is elevated, largely reflecting factors that are expected to be transitory.” Inflation, as measured by CPI-U, proved less transitory than the Fed thought, rising an additional 3.6% from 5.4% to a peak of 9% in June 2022.

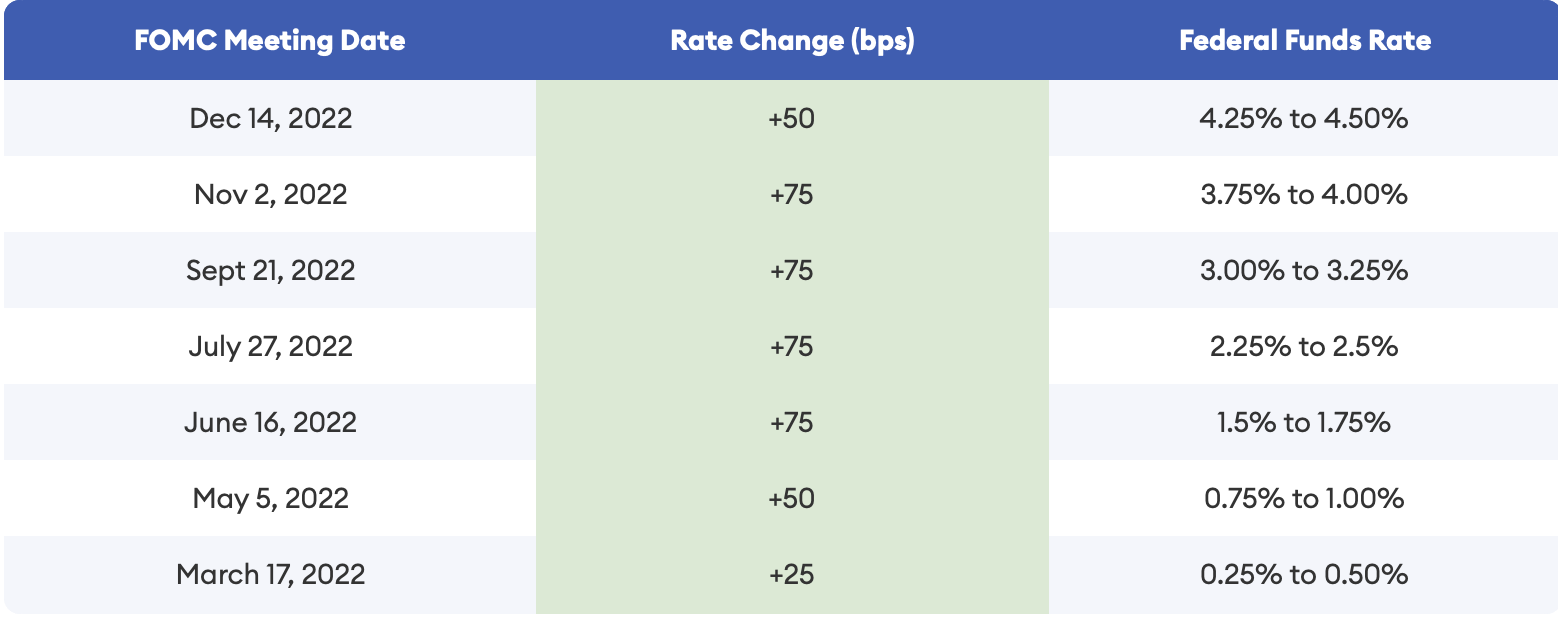
In 2022, the FOMC raised the target range for the Federal Funds Rate by 425 basis points to 4.25% - 4.50% in an attempt to dampen inflation.

Source: Forbes Advisor

For the first four months of the year, the Treasury yield curve steepened, signaling continued Fed rate increases, higher inflation, and a shift in demand for Treasuries relative to the supply of Treasuries. In the back half of the year, the yield curve flattened and finished the year slightly inverted, signaling slower economic growth on the horizon.

Source: treasury.gov, Two Centuries Investments

Because of their higher interest rate sensitivity (higher duration), long maturity Treasury portfolios experienced large declines, in the neighborhood of 30% drawdowns.

This chart shows the price performance of IEF (iShares 7-10 Year Treasury Bond ETF in purple) and TLT (iShares 20+ Year Treasury Bond ETF in blue).

The long duration equivalent in the equity market, namely growth stocks, declined by a similar percentage, also near 30%, as measured by the performance of the Russell 1000 Growth Index. The growth stock headwind dragged down the performance of the U.S. equity market, with the S&P 500 Index barely avoiding a 20% drawdown for the year.

This chart shows the price performance of SPY (SPDR S&P 500 Index ETF in purple), and IWG (iShares Russell 1000 Growth Index ETF in blue).

2. As we enter 2023, inflationary pressures are moderating. Interest rates for longer maturity Treasuries are likely approaching a peak.

Global supply chain issues have lessened, especially in the global shipping network. The prices of many goods are falling as the pandemic induced demand bounce has ended. Shipping container rates have plummeted towards pre-pandemic levels.

Source: Flexport

Prices have fallen rapidly for used passenger vehicles and computer hardware as previously spiking during the pandemic. Housing rents are rolling over, though the impact has yet to appear in the shelter cost component of CPI-U. The housing market faces the headwind of higher mortgage loan interest rates. Food price increases have likely peaked and energy prices have fallen, though we would caution against expecting further energy price declines.

With inflation moderating and no large tailwind for real economic growth, we suspect interest rates are approaching a peak.

3. Service sector inflation and wage pressures, along with de-globalization trends, will likely put a higher floor under inflation in the near term.

The labor market remain tight, largely due to the supply side. In particular, many older workers left the labor force during the pandemic and are not expected to return. The number of unemployed persons per job opening is at a low level relative to both recent history and the entire post World War II period.

Geopolitical tensions, especially with China, mean supply chains will be adjusted, resulting in higher costs. In addition, the massive influx of low cost Chinese labor into the global economy is over. China’s population has likely peaked. Wages in China have risen significantly over the last decade.

4. While U.S. equity market valuation multiples have contracted, the market is facing profitability headwinds due to higher expenses.

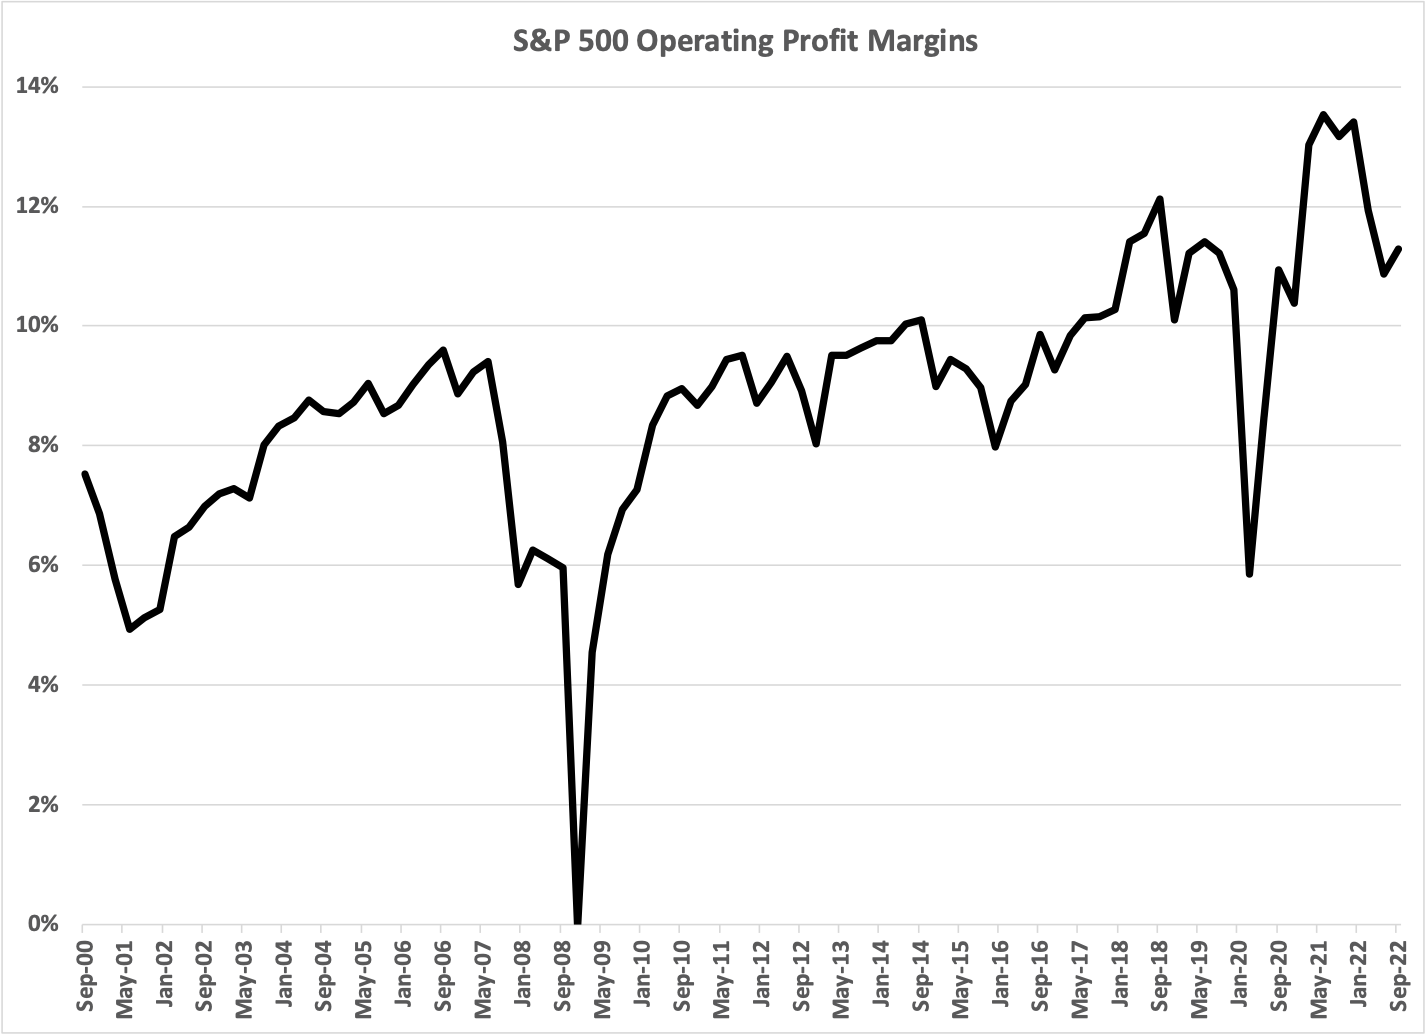
Much higher labor, materials, and equipment costs have reversed the trend of increasing operating profit margins. Higher interest expense and higher taxes will be additional headwinds to net income margins and earnings per share growth.

Source: spglobal.com, Two Centuries Investments

Non-US developed markets equities and emerging markets equities appear more attractive. Europe is facing energy related cost pressure due to the Russia-Ukraine conflict and China is facing a real estate crisis as it emerges from its zero-Covid economic activity restrictions, but valuation multiples outside the U.S. embed a lot of bad news already.

Source: Yardeni Research

5. The path forward for the U.S. equity market is encased in heavy fog. We suspect the path will be inseparable from the path of credit risk.

The heavy fog is due to several factors.

  • The new floor for inflation is impossible to predict.

  • The lagged effect of a sizable and rapid tightening of monetary policy on economic activity is difficult to predict.

  • The Fed’s reaction function is difficult to predict as the Fed balances inflation risk vs. recession risk.

  • China’s new trend line of economic growth is difficult to predict.

  • The damage done to the European economy from the Russia-Ukraine conflict and the accompanying energy crisis is difficult to predict.

If the Fed leans too hard in the direction of crushing inflation, an economic downturn is a near certainty and will manifest itself in rapidly rising credit risk.

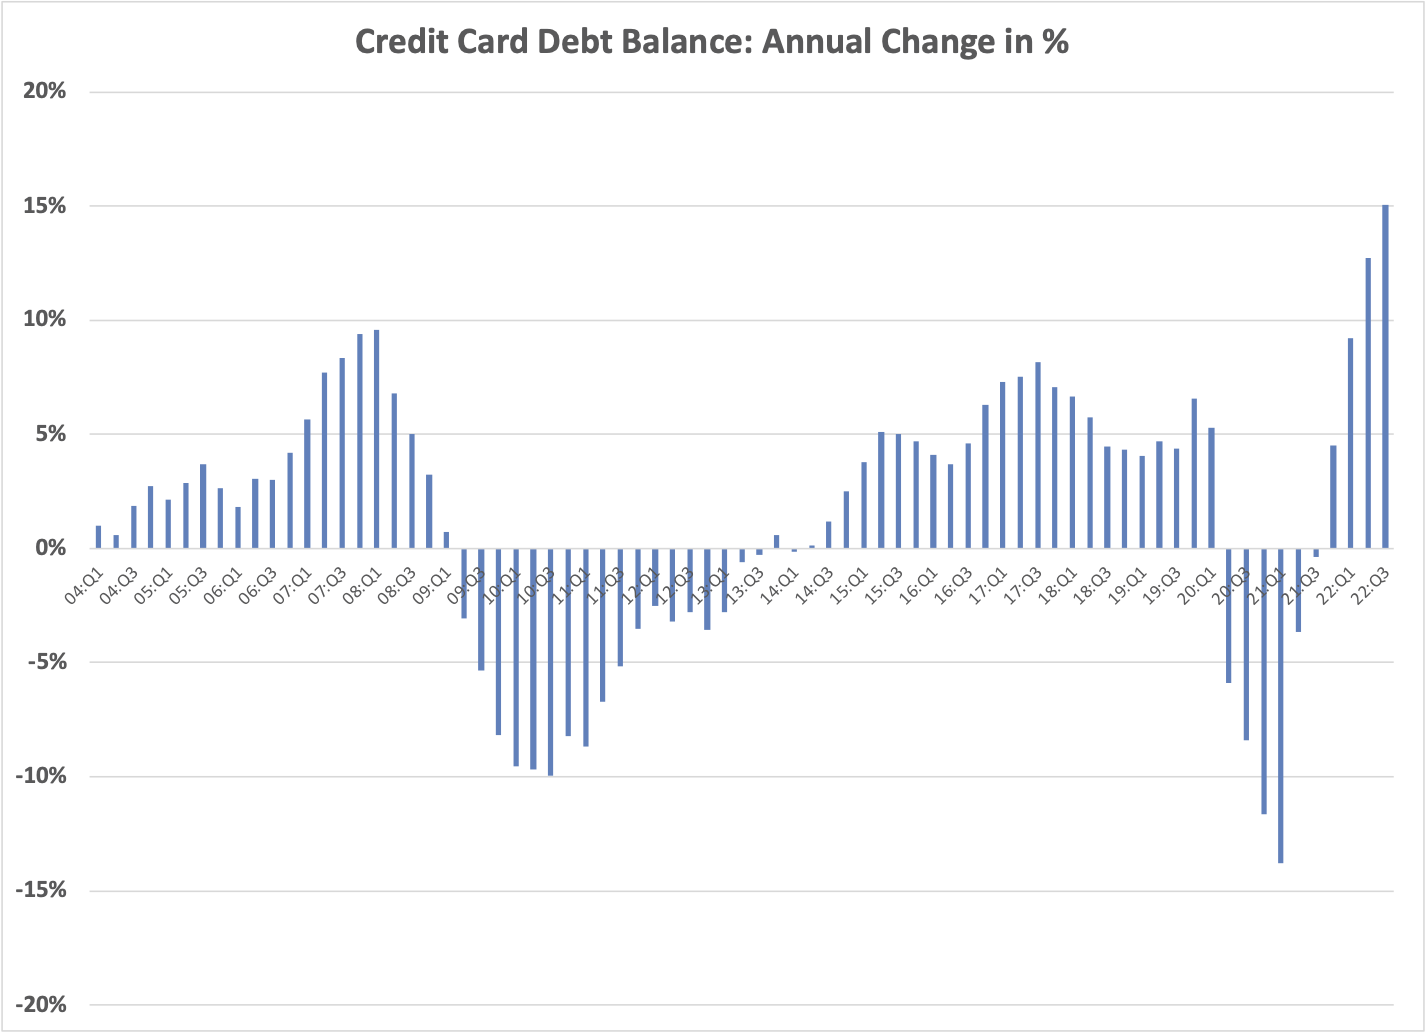
On the consumer front, we are monitoring credit card delinquencies. We do know consumers are running down the savings they built up during the pandemic.

Note: Data from July 1, 2012 to July 1, 2022

Credit card balances increased by over 10% annualized in the second and third quarters of 2022.

Source: New York Fed Consumer Credit Panel/Equifax

On the business front, we are monitoring corporate credit spreads, especially for below investment grade debt.

Leveraged loans (floating rate loans for lower quality issuers) experienced over 300 basis points in rate increases (higher interest expense) in 2022.

Source: Eaton Vance, data through September 30, 2022

Higher operating expenses and interest expense are starting to take a toll on some companies as the percentage of distressed loans has increased. However, the percentage is well below crisis levels.

Source: Eaton Vance, data through September 30, 2022

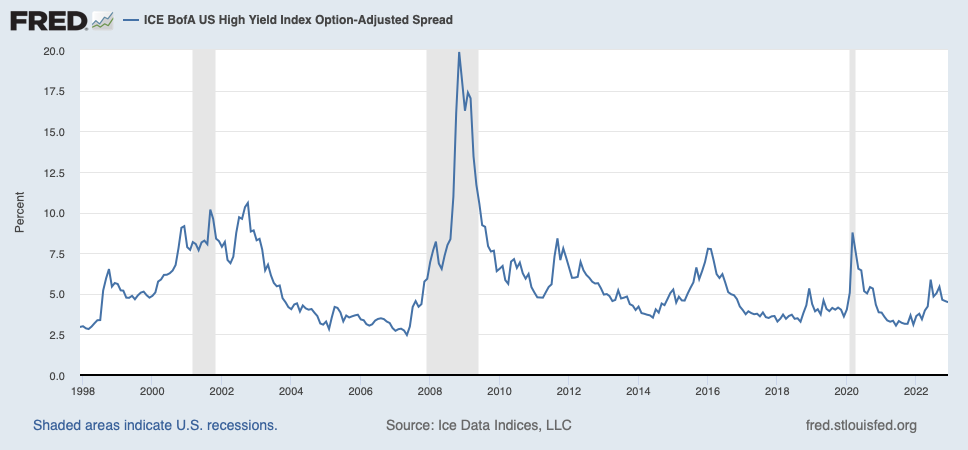
High yield debt spreads have risen 175 basis points from post pandemic lows, but still remain well below crisis levels.

6. Increased credit risk will translate to higher U.S. equity market volatility, even if a recession is not a near term outcome. We suspect the odds favor non-US equities, Treasuries, and gold relative to U.S. equities in 2023. Within U.S. equities, robust business models are the likely winners, with strong and sustained free cash flow growth, strong intangible assets, and / or revenues tied to commodities with structural supply issues.

December 2022 Market Update: Markets Rally, Cryptonite Captivates

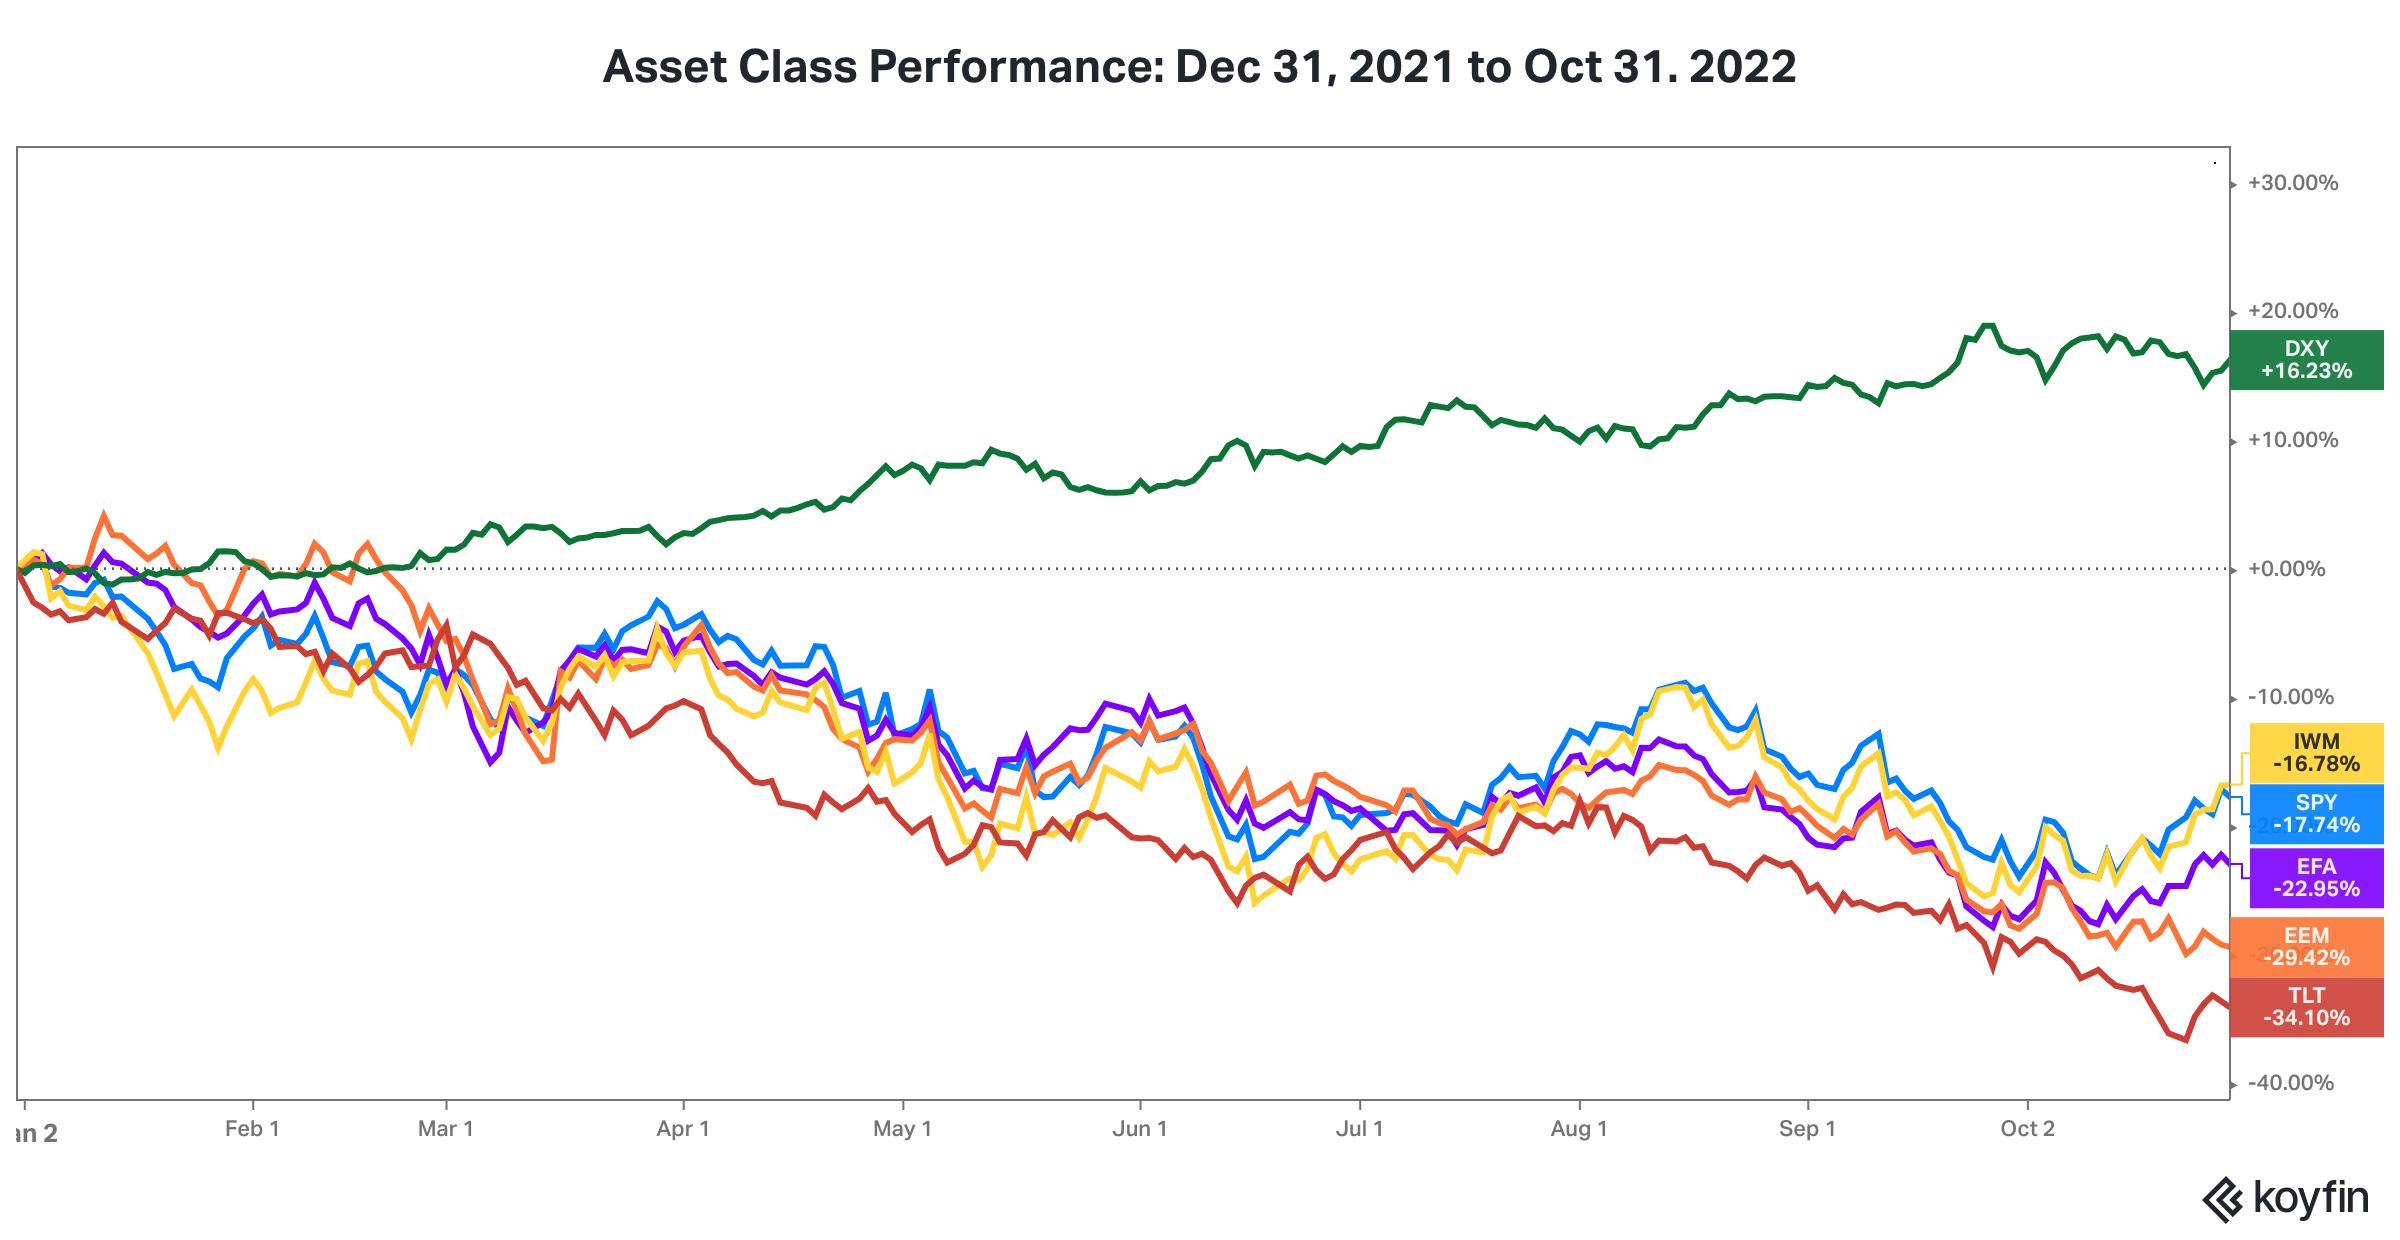
1. In November, almost every class exhibited a reversal of trend. Global equities rallied, led by non-US equity markets. Long maturity U.S. Treasuries rose in price and the U.S. dollar declined modestly.

This chart shows the price performance of SPY (SPDR S&P 500 Index ETF in blue), EFA (iShares MSCI EAFE ETF in purple), EEM (iShares MSCI Emerging Markets ETF in orange), and IWM (iShares Russell 2000 Index ETF in yellow), TLT (iShares 20+ Year Treasury Bond ETF in red) and DXY (U.S. Dollar Index in green) .

Year-to-date, equities and long maturity Treasury portfolios remain significantly underwater.

This chart shows the price performance of SPY (SPDR S&P 500 Index ETF in blue), EFA (iShares MSCI EAFE ETF in purple), EEM (iShares MSCI Emerging Markets ETF in orange), and IWM (iShares Russell 2000 Index ETF in yellow), TLT (iShares 20+ Year Treasury Bond ETF in red) and DXY (U.S. Dollar Index in green) .

2. In October, U.S. inflation rate (as measured by CPI-U) fell to 7.7% from September 8.2% and June’s 9.0% rate, which was the highest annual rate since the 1970s.

The moderation in inflation was likely a contributor to the reversal of the trend of asset class performance. If inflation continues to moderate at the pace experienced in October, it will facilitate an earlier end to the tightening of monetary policy.

3. While equity risk, interest rate risk, and inflation risk have hammered asset class performance this year, credit risk remains muted. We anticipate the trend in credit risk will drive financial market performance over the course of the next year.

While high yield credit spreads have risen almost 150 basis points year-to-date as of November 30, the level of credit spreads remains quite low compared to the last 25 years. From our perspective, the big question going forward is whether the combination of inflationary pressures, tighter monetary policy, and economic imbalances precipitate a credit crisis.

4. Is the lack of container ship backlog at the Ports of Los Angeles and Long Beach the proverbial canary in the coal mine?

Source: Freightwaves.com

As we noted late last year and earlier this year, strong demand for goods, supply chain issues, and global shipping network challenges led to an unprecedented container ship backlog at the Ports of Los Angeles and Long Beach. The backlog has evaporated. On November 22 and 23, there were no container ships waiting offshore at the ports.

Certainly, the global supply chain has adjusted as pandemic related economic restrictions have been removed. Certainly, there was a pull forward in demand for goods, so there will be a period of below trend demand. However, the labor, equipment, and warehouse issues at the ports have not been resolved. Thus, our concern is the lack of a backlog may be signaling economic weakness.

5. Credit risk has emerged in a few pockets of the economy. most notably in the cryptocurrency industry. The FTX bankruptcy filing was the latest and biggest outbreak of credit risk in the industry. As with almost every credit crisis these days, the cryptonite was financial engineering.

In last month’s monthly update, I noted “Understand cryptocurrencies are illiquid, intangible assets which do not generate cash flows, at least not organically. As a result, they do not represent quality collateral for lending.”

Part of the financial engineering revolved around the concept of yield farming, whereby cryptocurrency owners could lend their cryptocurrency and receive a high interest rate, much higher than rate in a commercial bank savings account or the yield on a money market fund.

This concept befuddled me, as cryptocurrencies do not generate cash flows, so it seemed much riskier than traditional securities lending (applied to stocks and bonds).

Many cryptocurrency companies engaged in yield farming also held low amounts of equity capital, i.e., they were highly levered. Commercial banks are required to hold higher equity capital and the banks even have the benefit of access to the Federal Reserve’s discount window.

In addition, the so-called cryptocurrency exchanges did not operate like traditional stock, commodity, and derivative exchanges, by managing counter-party (credit) risk tightly via daily, and often high, margin requirements.

Lastly, there seems to have been an incestuous relationship between several cryptocurrencies and cryptocurrency companies, meaning the cryptocurrencies and businesses were highly correlated.

Note 1: I am ignoring the allegations of fraud and focusing only on the structural problem of financial engineering, since it relates to my concern about credit risk lurking below the surface of the economy. While frauds can be large, they will be contained. Credit risk in systematic form is the big danger; it is hard to contain.

Note 2: Not all cryptocurrency industry players engaged in financial engineering, as some act as true custodians of customer assets, supported by compliance, risk management, and audit systems.

November 2022 Market Update: WhatsUpp with Financial Markets, META, and Crypto

1. In October, global equity markets rebounded, with the big exception being China, which weighed on emerging markets performance. Year-to-date, equities remain significantly underwater.

This chart shows the price performance SPY (SPDR S&P 500 Index ETF in blue), EFA (iShares MSCI EAFE ETF in orange), EEM (iShares MSCI Emerging Markets ETF in purple), and MCHI (iShares MSCI China ETF in yellow).

The Chinese stock market was the big outlier, reacting poorly to the outcome of the Communist Party Congress. Chinese Premier Xi Jinping will remain as leader for an historic third five-year term and be surrounded by loyalists in the Politburo. This concentration of power raised the concern China will be less focused on economic growth and more focused on domestic wealth inequality and national security issues. Zero-Covid policy, with associated activity restrictions, will also remain intact.

This chart shows the price performance SPY (SPDR S&P 500 Index ETF in blue), EFA (iShares MSCI EAFE ETF in orange), EEM (iShares MSCI Emerging Markets ETF in purple), and MCHI (iShares MSCI China ETF in yellow).

Has the sell-off in stocks finally ended? We doubt it for two reasons.

First, we haven’t witnessed the widespread investor despair that typically accompanies equity market bottoms. Second, the Federal Reserve will need to continue to tighten monetary policy to lower inflation to a more acceptable level.

That said, to the extent a credit crisis does not develop, we don’t anticipate anything like the equity market carnage we witnessed in the 2008 Global Financial Crisis.

2. In September, U.S. inflation rate (as measured by CPI-U) barely fell to a 8.2% from August’s 8.3% and June’s 9.0% rate, which was the highest annual rate since the 1970s.

We anticipate inflation in the U.S. to moderate as the demand for goods continues to ease post pandemic. However, labor market challenges, structurally higher energy prices, and supply chain challenges emanating from China will put a floor on the intermediate term range for inflation.

3. US interest rates continued their rise, wreaking havoc on all major asset classes, as the Federal Reserve raised the Federal Funds Rate target by 0.75% in October. The Fed has raised the rate by 3.50% so far in 2022.

Source: treasury.gov, Two Centuries Investments

4. Corporate earnings season highlighted the impact of rising expenses on earnings growth for many companies. Ex-energy, earnings growth will be negative for the S&P 500 for the second consecutive quarter.

As of November 4, 85% of the companies in the S&P 500 had reported quarterly earnings results for the third quarter of 2022. No surprise, the energy sector continues to be the star performer. Notably, the industrial sector also has shown strong revenue and earnings growth. The communication services, financials, and materials sectors have experienced double digit earnings declines, year over year.

While revenues grew 10.5% year-over-year, earnings growth only grew 2.2% as higher expenses lowered profit margins.

Labor cost growth is the primary culprit and is currently running about 200 basis points higher than its pre-pandemic trend.

5. Many companies with seemingly robust business models have performed poorly this year. Below, I briefly discuss the issues facing META, a company which scores highly in the “brand” category of our Focused Quality equity model. I use a discounted cash flow model framework.

META, which owns Facebook, Instagram, and WhatsApp, reported earnings on October 26 after the stock market close. On October 27, META's stock price declined 24%. Year-to-date through the end of October, the stock price had declined 72%. What happened to META, a company which is one the big three, along with GOOGL and AMZN, in the growing and oligopolistic digital advertising industry?

Certainly, higher interest rates have contributed to a higher equity discount rate (all else equal, namely the equity risk premium). This factor has impacted higher growth stocks, which have longer "durations", as more of the cash flows to equity shareholders are further out in the future. GOOGL was impacted similarly. Think of it as a contributor to valuation multiple compression.

The boost in digital advertising during the pandemic has ended. The economy is also slowing and advertisers are reducing all forms of spending. META faced the additional headwind of AAPL allowing iPhone owners to change their privacy settings to limit tracking by advertisers. In other words, revenue growth has slowed.

Higher operating expenses, including higher labor costs, reduced profitability as profit margins declined. Lastly, META committed to maintaining much higher capital expenditures (over $32 billion in 2022) to develop the "metaverse" and expand their artificial intelligence capabilities. There is no guarantee these expenditures will produce anywhere near the high Return on Invested Capital (ROIC) produced by META’s core advertising business.

Comparing 3q2022 to 3q2021...

Revenues declined from $29.0 billion to $27.7 billion.

Net Income declined from $9.2 billion to $4.4 billion.

Cash Flow from Operations declined from $14.1 billion to $9.7 billion.

Capital Expenditures increased from $4.3 billion to $9.4 billion.

“Free Cash Flow” declined from $9.8 billion to $0.3 billion.

In summary, lower revenues, higher operating expenses, and valuation multiple compression hit the stock, like they have hit other growth stocks this year. But two other META specific issues have led to additional underperformance, namely AAPL’s business decision and META’s decision to spend aggressively to build a new business at as time when most companies are spending cautiously due to emerging economic growth headwinds.

6. As I was writing this monthly update, news broke about the failure of FTX, one of the largest cryptocurrency exchanges. While we await more details, I will highlight a few principles, likely applicable to the FTX situation and which we articulate to our clients who are considering investing in crypto.

1) Know the protections available, or not available, with the safekeeping of your assets.

2) Understand cryptocurrencies are illiquid, intangible assets which do not generate cash flows, at least not organically. As a result, they do not represent quality collateral for lending.

3) Be wary of a financial market exchange that has not subjected itself to the rules and best practices governing public financial market exchanges. In the FTX situation, FTX engaged in a related party transaction with the hedge fund Alameda Research.

4) Research the legal framework and creditor status that will be applicable if an insolvency occurs.

June 2022 Market Update: Waiting for the Fog to Go

Where is the inflation rate ultimately headed? Financial market action during May reflected the lack of clarity on inflation’s future path. Corporate earnings season highlighted the consequences of the government policies that have facilitated higher inflation. Our optimism inflation will moderate is tempered by our concern about a potential energy crisis.

1. The US stock market eked out a small gain in May. Stocks have returned -12.8% year-to-date as proxied by the S&P 500 Index. Higher expenses due to labor and supply chain issues, tighter financial conditions driven by Federal Reserve actions to squash inflation, and burgeoning concerns about decelerating revenues remain headwinds to stock prices.

Before a bounce during the last week of May, US equity prices had declined over 18% from the start of the year.

This chart shows the price performance of SPY (the SPDR S&P 500 Index ETF in blue).

While nine of the eleven equity sectors have negative returns year-to-date, most of the damage has occurred in the consumer discretionary, communication services, and information technology sectors, which have returned -24.3%, -22.3%, and -19.1% respectively. Combined these sectors constituted 51.9% of the S&P 500 Index at the beginning of the year.

This chart shows the price performance of SPY (the SPDR S&P 500 Index ETF in blue), XLK (the Technology Select Sector SPDR Fund in yellow), XLC (the Communications Services Select Sector SPDR Fund in orange) and XLY (the Consumer Discretionary Select Sector SPDR Fund in purple).

2. First quarter 2022 earnings were solid but revealed two big challenges facing most businesses. First, higher expenses are eating into profitability. Second, uncertainty about the composition of demand has made planning and inventory management more difficult. Consumer spending preferences have shifted post pandemic and inflation has constrained budgets for non-discretionary items.

With 97% of companies having reported earnings, S&P 500 revenues increased 13.6% year-over-year. Nine sectors saw revenue growth above 7.5%, an outstanding but likely unsustainable result.

Unfortunately, expenses increased faster than revenues for many companies, so S&P 500 earnings only increased 9.2%, a 440 basis points haircut to revenue growth. In other words, profit margins declined, a result investors are worried will become a trend.

Year-over-year, net profit margins decreased for 50% of the S&P 500 companies. The financial and consumer discretionary sectors experienced the largest declines in profit margins.

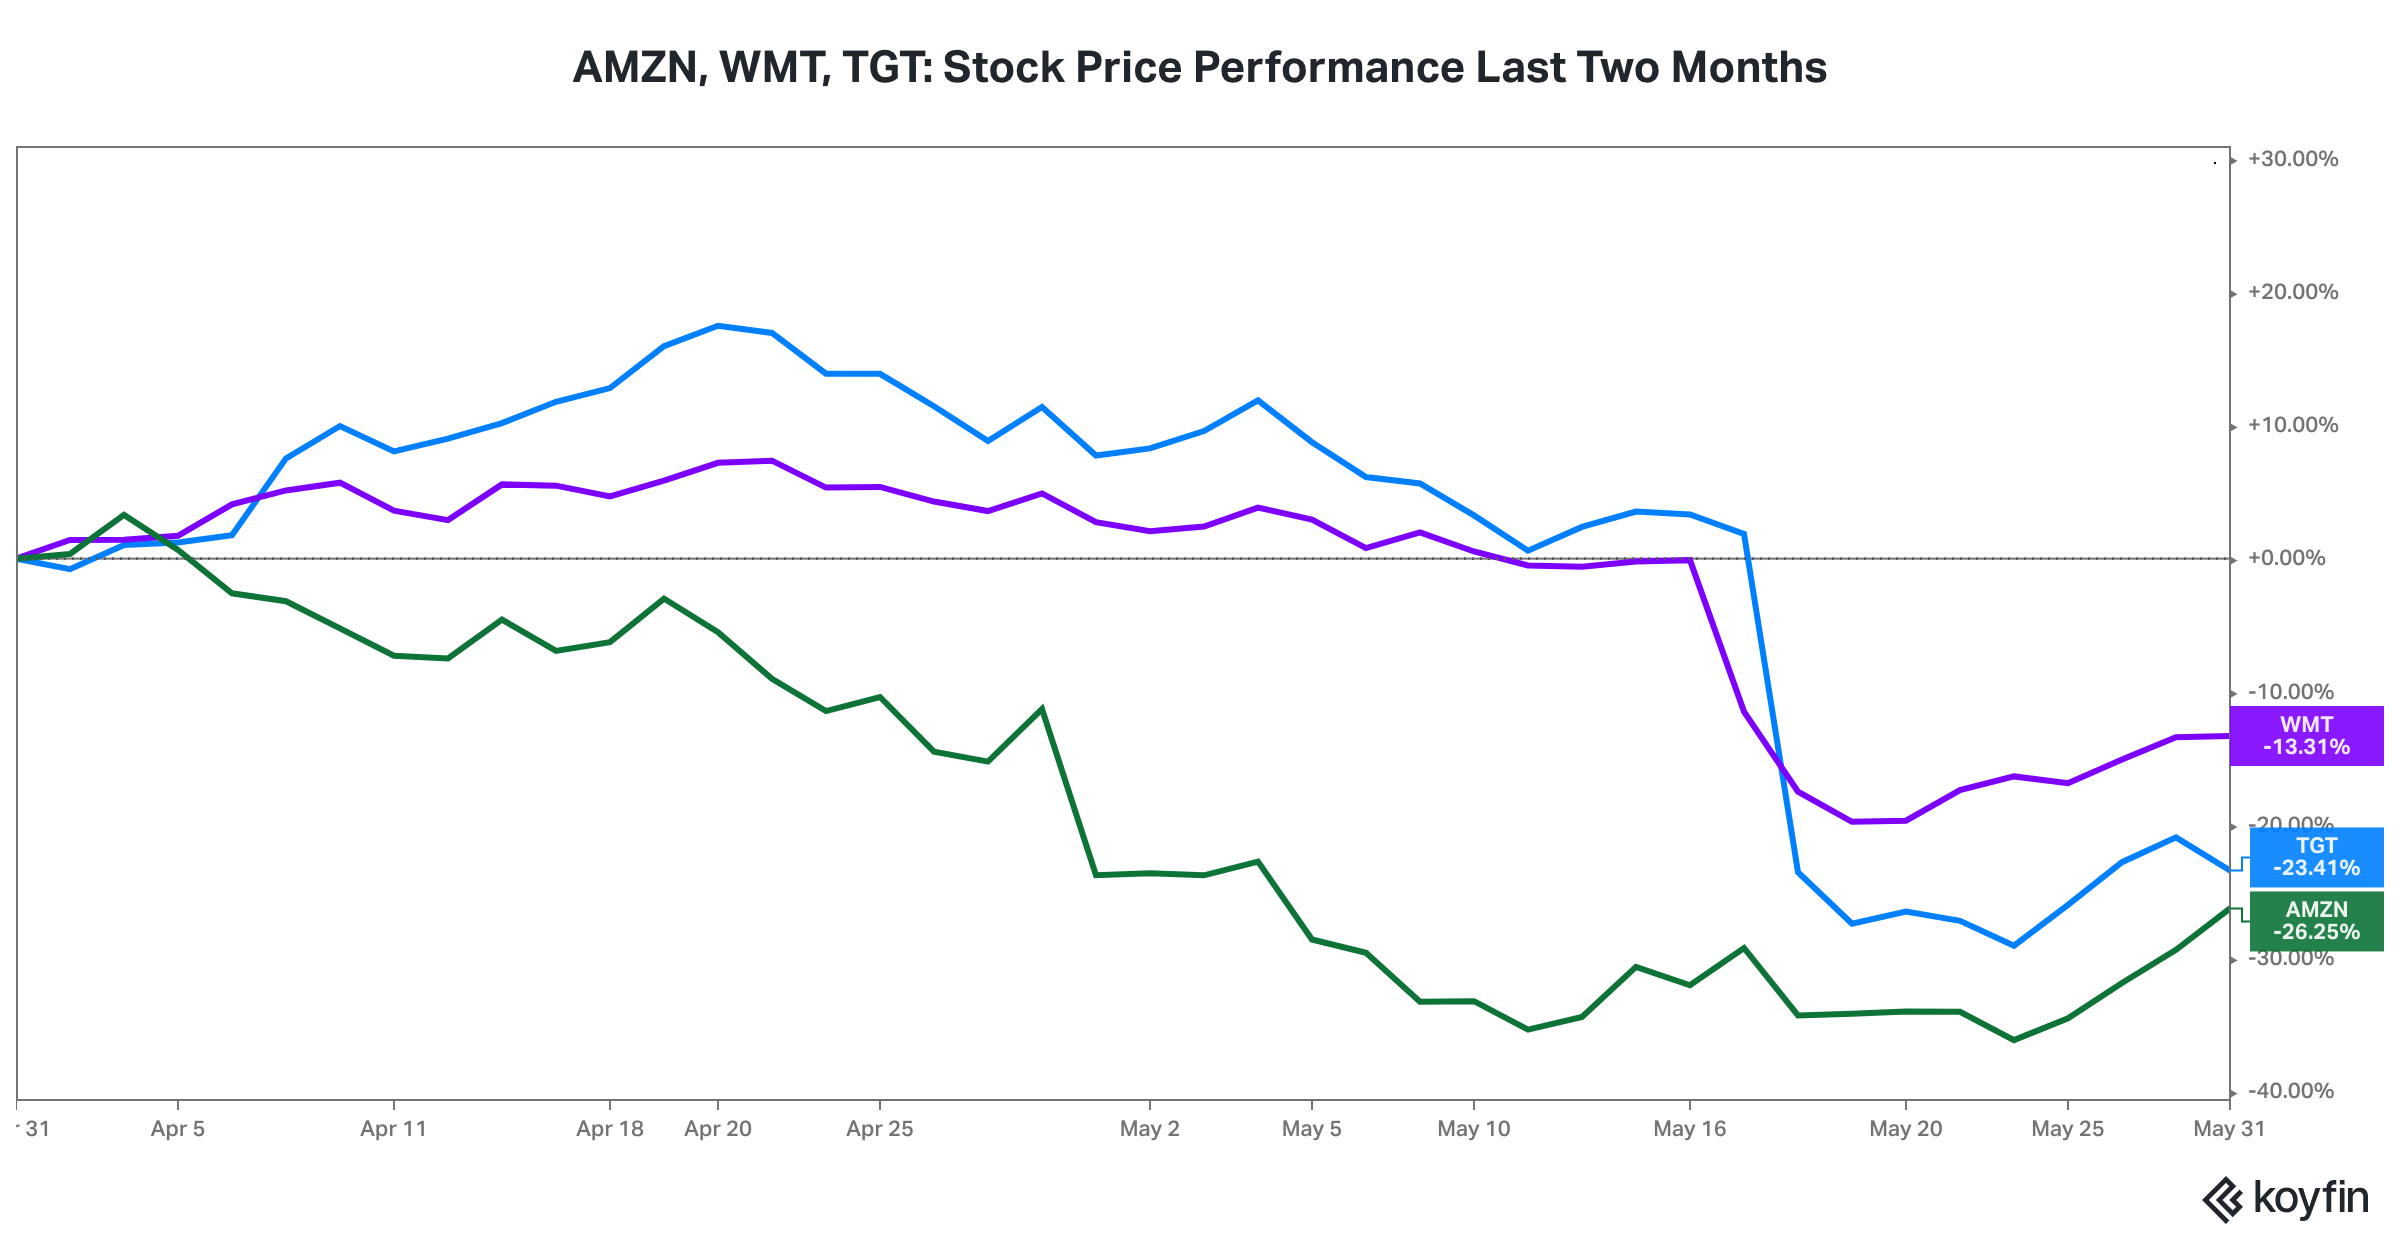
Three of the best managed consumer companies, namely Amazon, Walmart, and Target, acknowledged inventory issues, in addition to rising costs. The excess inventory will have to be marked down in price. The composition of consumer spending has shifted rapidly, particularly away from big ticket goods to services, like travel and entertainment. In addition, the rising prices of certain non-discretionary items, especially gasoline and foods, and rising home mortgage rates have put the squeeze to consumer budgets.

This chart shows the price performance of AMZN (Amazon.com, Inc. in green), WMT (Walmart Inc in purple), and TGT (Target Corporation in blue).

3. In May, the ups and downs of the bond market (interest rates and credit spreads) reflected the uncertainty about inflation’s path, the Fed’s potential reaction function, and the implications (recession?) if the Fed backs up its tough talk with substantial interest rate hikes.

The ten-year Treasury yield spiked 23 basis points in the first week of May to 3.12%, representing an 160 basis point increase from the beginning of the year. That pace of increase was unprecedented, was not sustainable, and began to raise fears of monetary tightening induced recession. By month end, the ten-year Treasury yield had settled at 2.85%, just below where it ended April.

Source: treasury.gov

Credit spreads acted similarly to US equities and interest rates, moving rapidly in one direction at the beginning of the month before reversing direction. High yield spreads spiked 100 basis points from the beginning of the month through May 24, before giving back 70 basis points of the rise during the last week of the month.

The combination of rapidly rising interest rates and rising credit spreads has translated to one of the worst historical periods for bond market returns. Even US Treasuries, which outperform during recessions and crises, have generated negative returns. The worst performing segment has been long-maturity Treasuries, often considered the flight to quality asset. Depending on the benchmark, long-maturity Treasuries have generated returns in the neighborhood of negative 20% year-to-date.

A rebound in long maturity Treasury yields was not surprising given the easing of pandemic related economic restrictions, the spike in inflation, and the Federal Reserve’s stated monetary tightening plan, i.e., Fed Funds rate increases and the ending of the asset purchase program. As long as inflation moderates, we suspect most of the increase in long maturity Treasury yields is in the rear view mirror.

This chart shows the performance of AGG (iShares Core U.S. Aggregate Bond ETF in purple), JNK (SPDR Bloomberg Barclays High Yield ETF in orange), and TLT (iShares 20+ Year Treasury Bond ETF in blue).

4. Our big concern for financial markets is energy prices, driven by the current energy supply crisis. In particular, if crude oil prices continue to climb, it may not be possible for the Federal Reserve to put the inflation genie back in the bottle without a severe recession. Even in a non-recessionary outcome, higher energy prices will weigh on corporate revenues, corporate profitability, and company valuations, outside of a small number of energy companies.

The price of crude oil continued its march higher in May.

This chart shows the price of WTI crude oil futures.

The price of US natural gas has doubled since the beginning of the year.

This chart shows the price of US natural gas futures in mmbtu (1 Million British Thermal Units) on the New York Mercantile Exchange.

Higher energy prices (a) feed into food prices, especially via higher fertilizer costs, (b) increase expenses for most businesses, (c) reduce non-discretionary spending for most consumers, (d) raise the cost of global trade, (e) make long term planning more difficult for businesses, thus reducing management’s proclivity for longer-term, productivity investments in R&D, plant, property, and equipment, and (f) arguably raise the cost of capital via higher risk premiums, thus reducing valuations.

Given some time, the US economy and most well-capitalized companies, especially those with valuable intangible assets, can adapt to shocks, including tightening monetary policy. There may be no such thing as successfully adapting to an energy crisis.

August 2021 Market Update: Lucky 7

Here are the top market developments from August. Along with a few questions.

1. US equities rose for the 7th month in a row. Is the price right?

Lucky Seven is a game on the well-known show “The Price is Right”. More than luck was in play as the S&P 500 Index rose for a seventh straight month in August. Strong corporate earnings, accompanied by a favorable backdrop of accommodative monetary policy and a massive increase in fiscal expenditures, have driven a 20.4% rise in the index year-to-date. According to FactSet, S&P 500 earnings were up 89% year-over-year in the second quarter of 2021 (with 91% of companies having reported).

Factset_2qEarnings_US.png

The US equity market is now up over 100% since the March 23, 2020 low. Some investors are starting to wonder whether the price is right, or too high, for US equities.

2. Earnings growth is through the roof in Europe. Is the price better?

Second quarter earnings growth was even stronger in Europe than in the US. According to FactSet, with more than 85% of companies in the STOXX Europe 600 Index having reported, earnings are up 248% year-over-year.

Factset_2qEarnings_Europe.png

Admittedly, Europe benefited more from operating leverage as the revenue differential (30% growth in Europe vs. 25% growth in the US) was much smaller than the earnings differential (248% growth in Europe vs. 89% growth in the US).

We have been warming up to non-US equities. The pricing appears to be better than US equities. For instance, while European equities usually trade a lower P/E multiple than US equities, they are currently trading around six multiple points lower than the US, European earnings growth has accelerated past US earnings growth, and European equities have underperformed US equities by over 25% since the March 23, 2020 pandemic low. A performance catch up is starting to seem more plausible.

Source: Yardeni ResearchThis chart shows forward Price / Earnings ratios for different regions, using MSCI index data.

Source: Yardeni Research

This chart shows forward Price / Earnings ratios for different regions, using MSCI index data.

3. US growth stocks have staged a performance rebound versus US value stocks. Is the bull market for growth stocks back on track?

US value stocks outperformed US growth stocks for the first five months of the year as an economic activity boom with accelerating inflation was the dominant narrative. However, over the three months ending in August, growth stocks have staged a big comeback. The narrative has started to shift from a fear of inflation to a concern about the sustainable level of revenue growth.

The graph shows the total return for the iShares Russell 1000 Growth ETF (IWF) in orange and the iShares Russell 1000 Value ETF (IWD) in purple for the three months ending in August 2021.

The graph shows the total return for the iShares Russell 1000 Growth ETF (IWF) in orange and the iShares Russell 1000 Value ETF (IWD) in purple for the three months ending in August 2021.

4. While inflation bears monitoring, so does credit risk. Is the compensation for credit risk currently too low?

Of the four questions we have raised, we have the most conviction in answering the last question. Yes, the compensation for credit risk is too low. It might be Bonkers (“The Price Is Right” show has a game by that name). Certainly, the monetary and fiscal stimulus over the last year and a half has boosted economic activity and spared many businesses from more negative outcomes. The US commercial banking system is also in excellent health. The sharp decline in credit spreads from the pandemic highs reflects the uptick in prospects for many non-financial businesses and the strong capital position of the banking system.

Source: St. Louis Federal Reserve Economic DataThis chart shows ICE BoFA High Yield Bond Index credit spreads from December 1996 - August 2021.

Source: St. Louis Federal Reserve Economic Data

This chart shows ICE BoFA High Yield Bond Index credit spreads from December 1996 - August 2021.

However, high yield bond spreads are near the lows of the last 25 years, at a time when interest rates are also near secular lows, debt levels are at a record high for the non-financial business sector, and trend rate of growth of economic activity is lower because productivity has not been able to offset a declining labor participation ratio. While we do not see an immediate cause for the concern, a shock that precipitates a rapid rise in debt costs may not be as manageable for the overall economy as it was in the past. Fragility has increased.