
Where is the inflation rate ultimately headed? Financial market action during May reflected the lack of clarity on inflation’s future path. Corporate earnings season highlighted the consequences of the government policies that have facilitated higher inflation. Our optimism inflation will moderate is tempered by our concern about a potential energy crisis.
1. The US stock market eked out a small gain in May. Stocks have returned -12.8% year-to-date as proxied by the S&P 500 Index. Higher expenses due to labor and supply chain issues, tighter financial conditions driven by Federal Reserve actions to squash inflation, and burgeoning concerns about decelerating revenues remain headwinds to stock prices.
Before a bounce during the last week of May, US equity prices had declined over 18% from the start of the year.

This chart shows the price performance of SPY (the SPDR S&P 500 Index ETF in blue).
While nine of the eleven equity sectors have negative returns year-to-date, most of the damage has occurred in the consumer discretionary, communication services, and information technology sectors, which have returned -24.3%, -22.3%, and -19.1% respectively. Combined these sectors constituted 51.9% of the S&P 500 Index at the beginning of the year.

This chart shows the price performance of SPY (the SPDR S&P 500 Index ETF in blue), XLK (the Technology Select Sector SPDR Fund in yellow), XLC (the Communications Services Select Sector SPDR Fund in orange) and XLY (the Consumer Discretionary Select Sector SPDR Fund in purple).
2. First quarter 2022 earnings were solid but revealed two big challenges facing most businesses. First, higher expenses are eating into profitability. Second, uncertainty about the composition of demand has made planning and inventory management more difficult. Consumer spending preferences have shifted post pandemic and inflation has constrained budgets for non-discretionary items.
With 97% of companies having reported earnings, S&P 500 revenues increased 13.6% year-over-year. Nine sectors saw revenue growth above 7.5%, an outstanding but likely unsustainable result.

Unfortunately, expenses increased faster than revenues for many companies, so S&P 500 earnings only increased 9.2%, a 440 basis points haircut to revenue growth. In other words, profit margins declined, a result investors are worried will become a trend.

Year-over-year, net profit margins decreased for 50% of the S&P 500 companies. The financial and consumer discretionary sectors experienced the largest declines in profit margins.

Three of the best managed consumer companies, namely Amazon, Walmart, and Target, acknowledged inventory issues, in addition to rising costs. The excess inventory will have to be marked down in price. The composition of consumer spending has shifted rapidly, particularly away from big ticket goods to services, like travel and entertainment. In addition, the rising prices of certain non-discretionary items, especially gasoline and foods, and rising home mortgage rates have put the squeeze to consumer budgets.
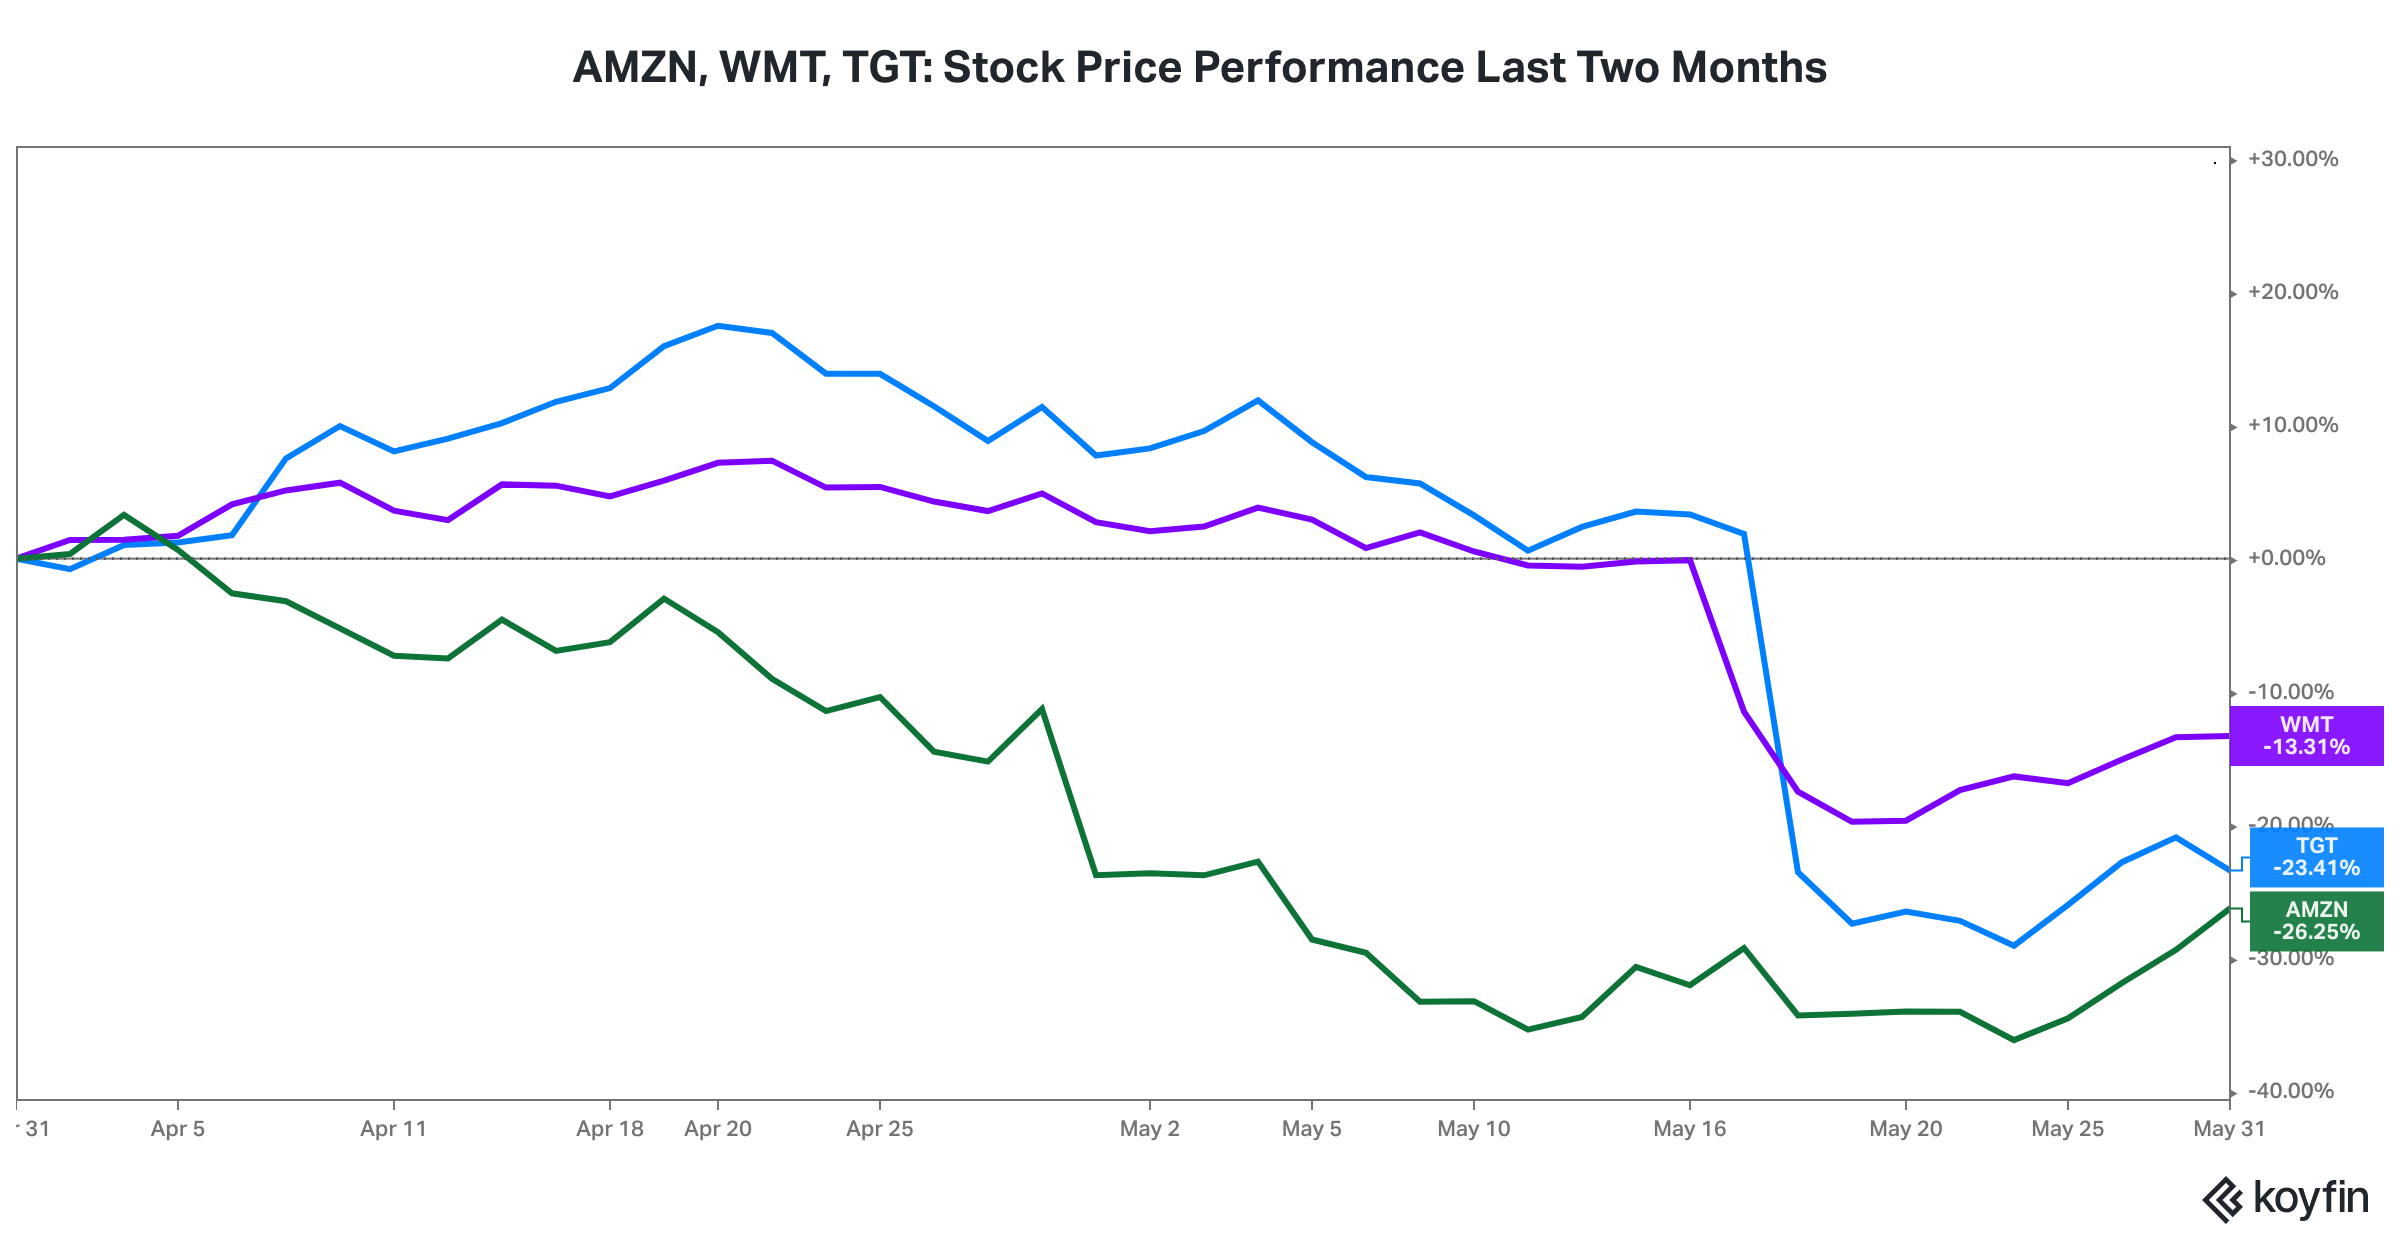
This chart shows the price performance of AMZN (Amazon.com, Inc. in green), WMT (Walmart Inc in purple), and TGT (Target Corporation in blue).
3. In May, the ups and downs of the bond market (interest rates and credit spreads) reflected the uncertainty about inflation’s path, the Fed’s potential reaction function, and the implications (recession?) if the Fed backs up its tough talk with substantial interest rate hikes.
The ten-year Treasury yield spiked 23 basis points in the first week of May to 3.12%, representing an 160 basis point increase from the beginning of the year. That pace of increase was unprecedented, was not sustainable, and began to raise fears of monetary tightening induced recession. By month end, the ten-year Treasury yield had settled at 2.85%, just below where it ended April.

Source: treasury.gov
Credit spreads acted similarly to US equities and interest rates, moving rapidly in one direction at the beginning of the month before reversing direction. High yield spreads spiked 100 basis points from the beginning of the month through May 24, before giving back 70 basis points of the rise during the last week of the month.

The combination of rapidly rising interest rates and rising credit spreads has translated to one of the worst historical periods for bond market returns. Even US Treasuries, which outperform during recessions and crises, have generated negative returns. The worst performing segment has been long-maturity Treasuries, often considered the flight to quality asset. Depending on the benchmark, long-maturity Treasuries have generated returns in the neighborhood of negative 20% year-to-date.
A rebound in long maturity Treasury yields was not surprising given the easing of pandemic related economic restrictions, the spike in inflation, and the Federal Reserve’s stated monetary tightening plan, i.e., Fed Funds rate increases and the ending of the asset purchase program. As long as inflation moderates, we suspect most of the increase in long maturity Treasury yields is in the rear view mirror.

This chart shows the performance of AGG (iShares Core U.S. Aggregate Bond ETF in purple), JNK (SPDR Bloomberg Barclays High Yield ETF in orange), and TLT (iShares 20+ Year Treasury Bond ETF in blue).
4. Our big concern for financial markets is energy prices, driven by the current energy supply crisis. In particular, if crude oil prices continue to climb, it may not be possible for the Federal Reserve to put the inflation genie back in the bottle without a severe recession. Even in a non-recessionary outcome, higher energy prices will weigh on corporate revenues, corporate profitability, and company valuations, outside of a small number of energy companies.
The price of crude oil continued its march higher in May.

This chart shows the price of WTI crude oil futures.
The price of US natural gas has doubled since the beginning of the year.

This chart shows the price of US natural gas futures in mmbtu (1 Million British Thermal Units) on the New York Mercantile Exchange.
Higher energy prices (a) feed into food prices, especially via higher fertilizer costs, (b) increase expenses for most businesses, (c) reduce non-discretionary spending for most consumers, (d) raise the cost of global trade, (e) make long term planning more difficult for businesses, thus reducing management’s proclivity for longer-term, productivity investments in R&D, plant, property, and equipment, and (f) arguably raise the cost of capital via higher risk premiums, thus reducing valuations.
Given some time, the US economy and most well-capitalized companies, especially those with valuable intangible assets, can adapt to shocks, including tightening monetary policy. There may be no such thing as successfully adapting to an energy crisis.