In April, tightening financial conditions weighed on asset prices, especially long-term Treasury bonds. Price volatility crept higher across all asset classes. There were few places to hide.
1. US Treasuries took another beating in April. Long-term interest rates spiked in anticipation of the FOMC aggressively hiking the Federal Funds Rate.
In April, the ten year Treasury yield rose 57 bps. It has risen 137 bps year to date. Likewise, in April, the thirty year Treasury yield rose 52 bps. It has risen 106 bps year to date.
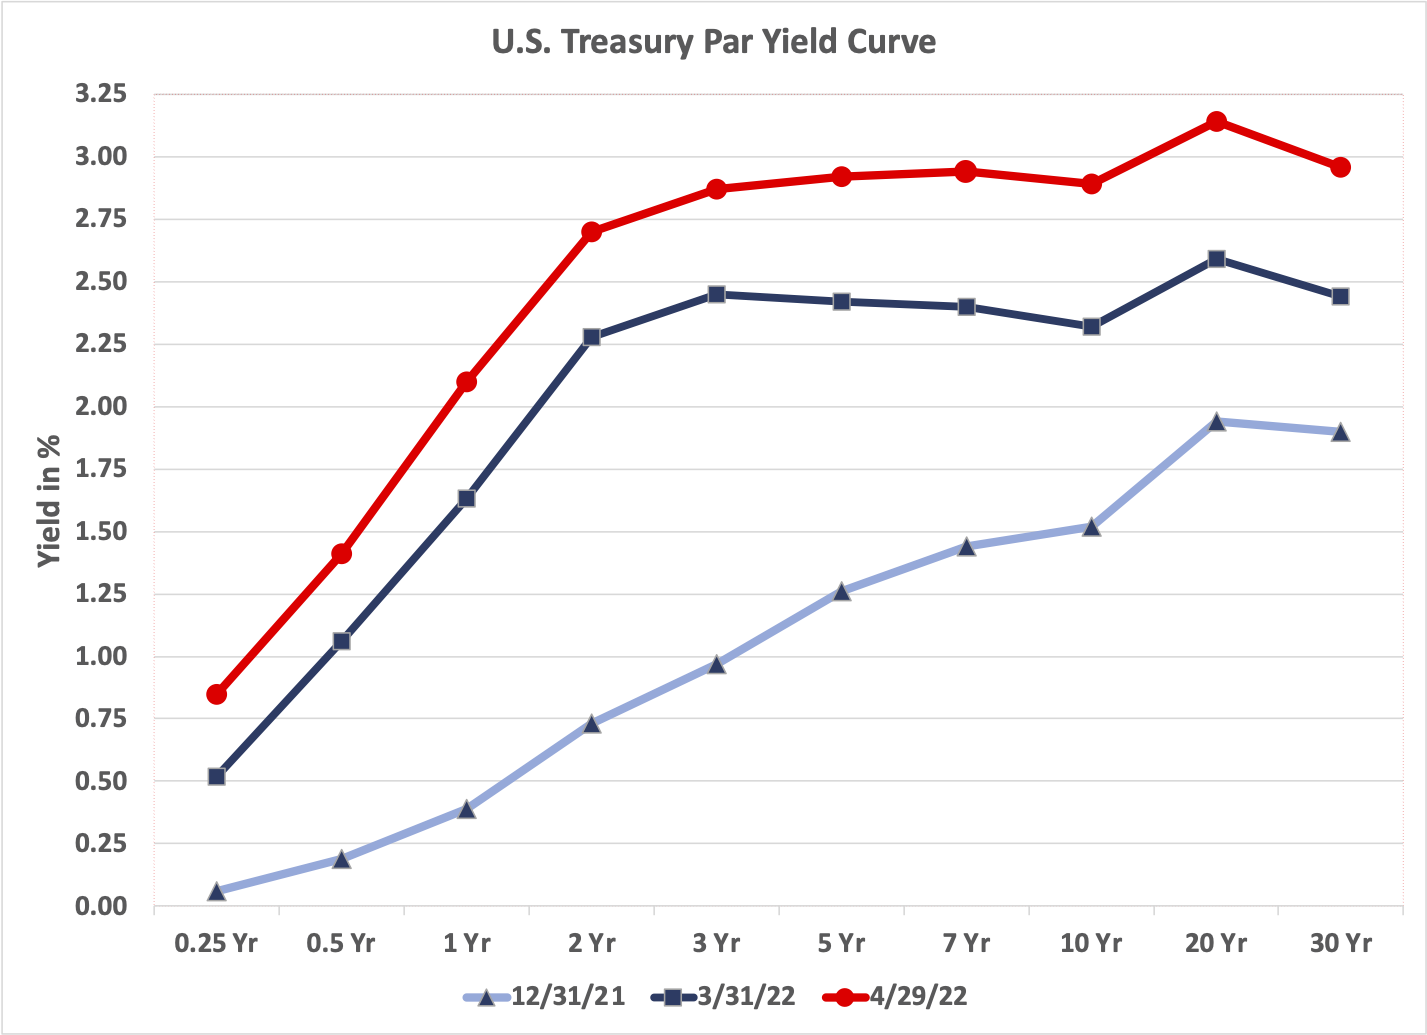
Source: treasury.gov
Year-to-date, long maturity Treasuries have declined in price by almost 20%. Because of their high interest rate duration, long maturity Treasuries have underperformed both investment grade bonds and high yield bonds.

This chart shows the price performance of SRLN (SPDR Blackstone Senior Loan ETF in dashed green), JNK (SPDR Bloomberg Barclays High Yield ETF in orange), LQD (iShares iBoxx $ Investment Grade Corporate Bond ETF in dashed purple), and TLT (iShares 20+ Year Treasury Bond ETF in blue).
Prices for Fed Funds futures contracts imply the FOMC will raise the Fed Funds Rate by 250 bps by year end 2022.

Source: CME
The Fed’s aggressive tightening posture, in combination with labor market headwinds to real economic growth and a likely moderation of inflation to a mid single digit rate, means the pace of normalization (rate of increase) of long term interest rates will slow.
2. Equity markets started to price in rapidly tightening liquidity conditions as they declined sharply in April, adding to 2022 performance woes.
US equities, non-US developed markets equities and emerging markets equities all experienced similar declines in April.
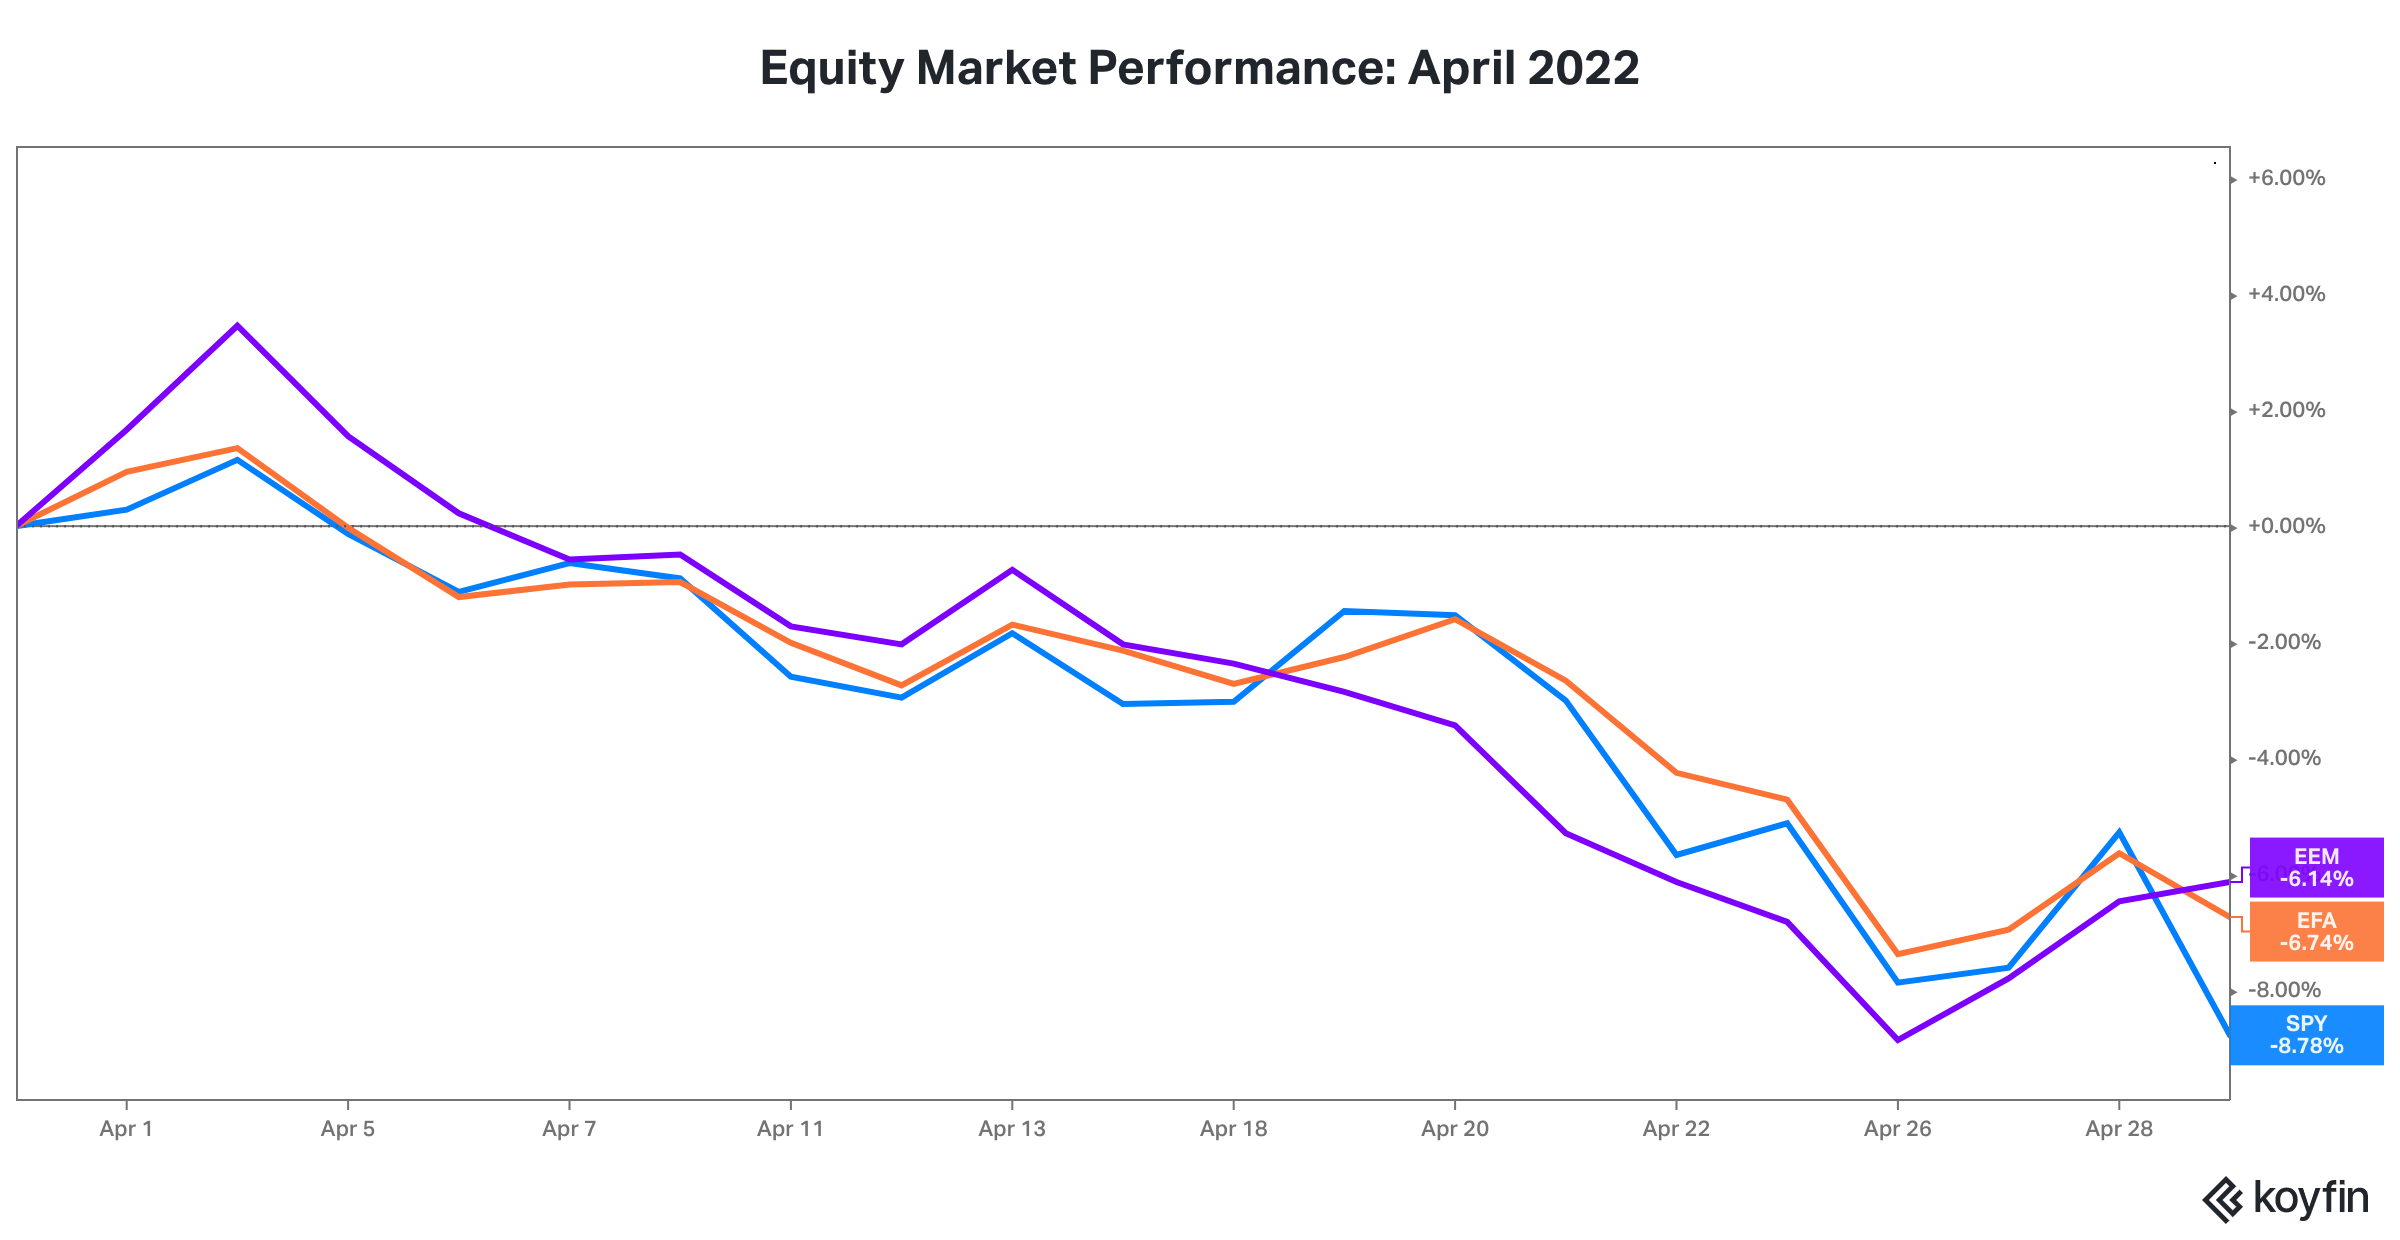
This chart shows the price performance of SPY (the SPDR S&P 500 Index ETF in blue), EFA (iShares MSCI EAFE ETF in orange), and EEM (iShares MSCI Emerging Markets ETF in purple).
Year-to-date, all three major equity asset classes have declined by more than 12%.
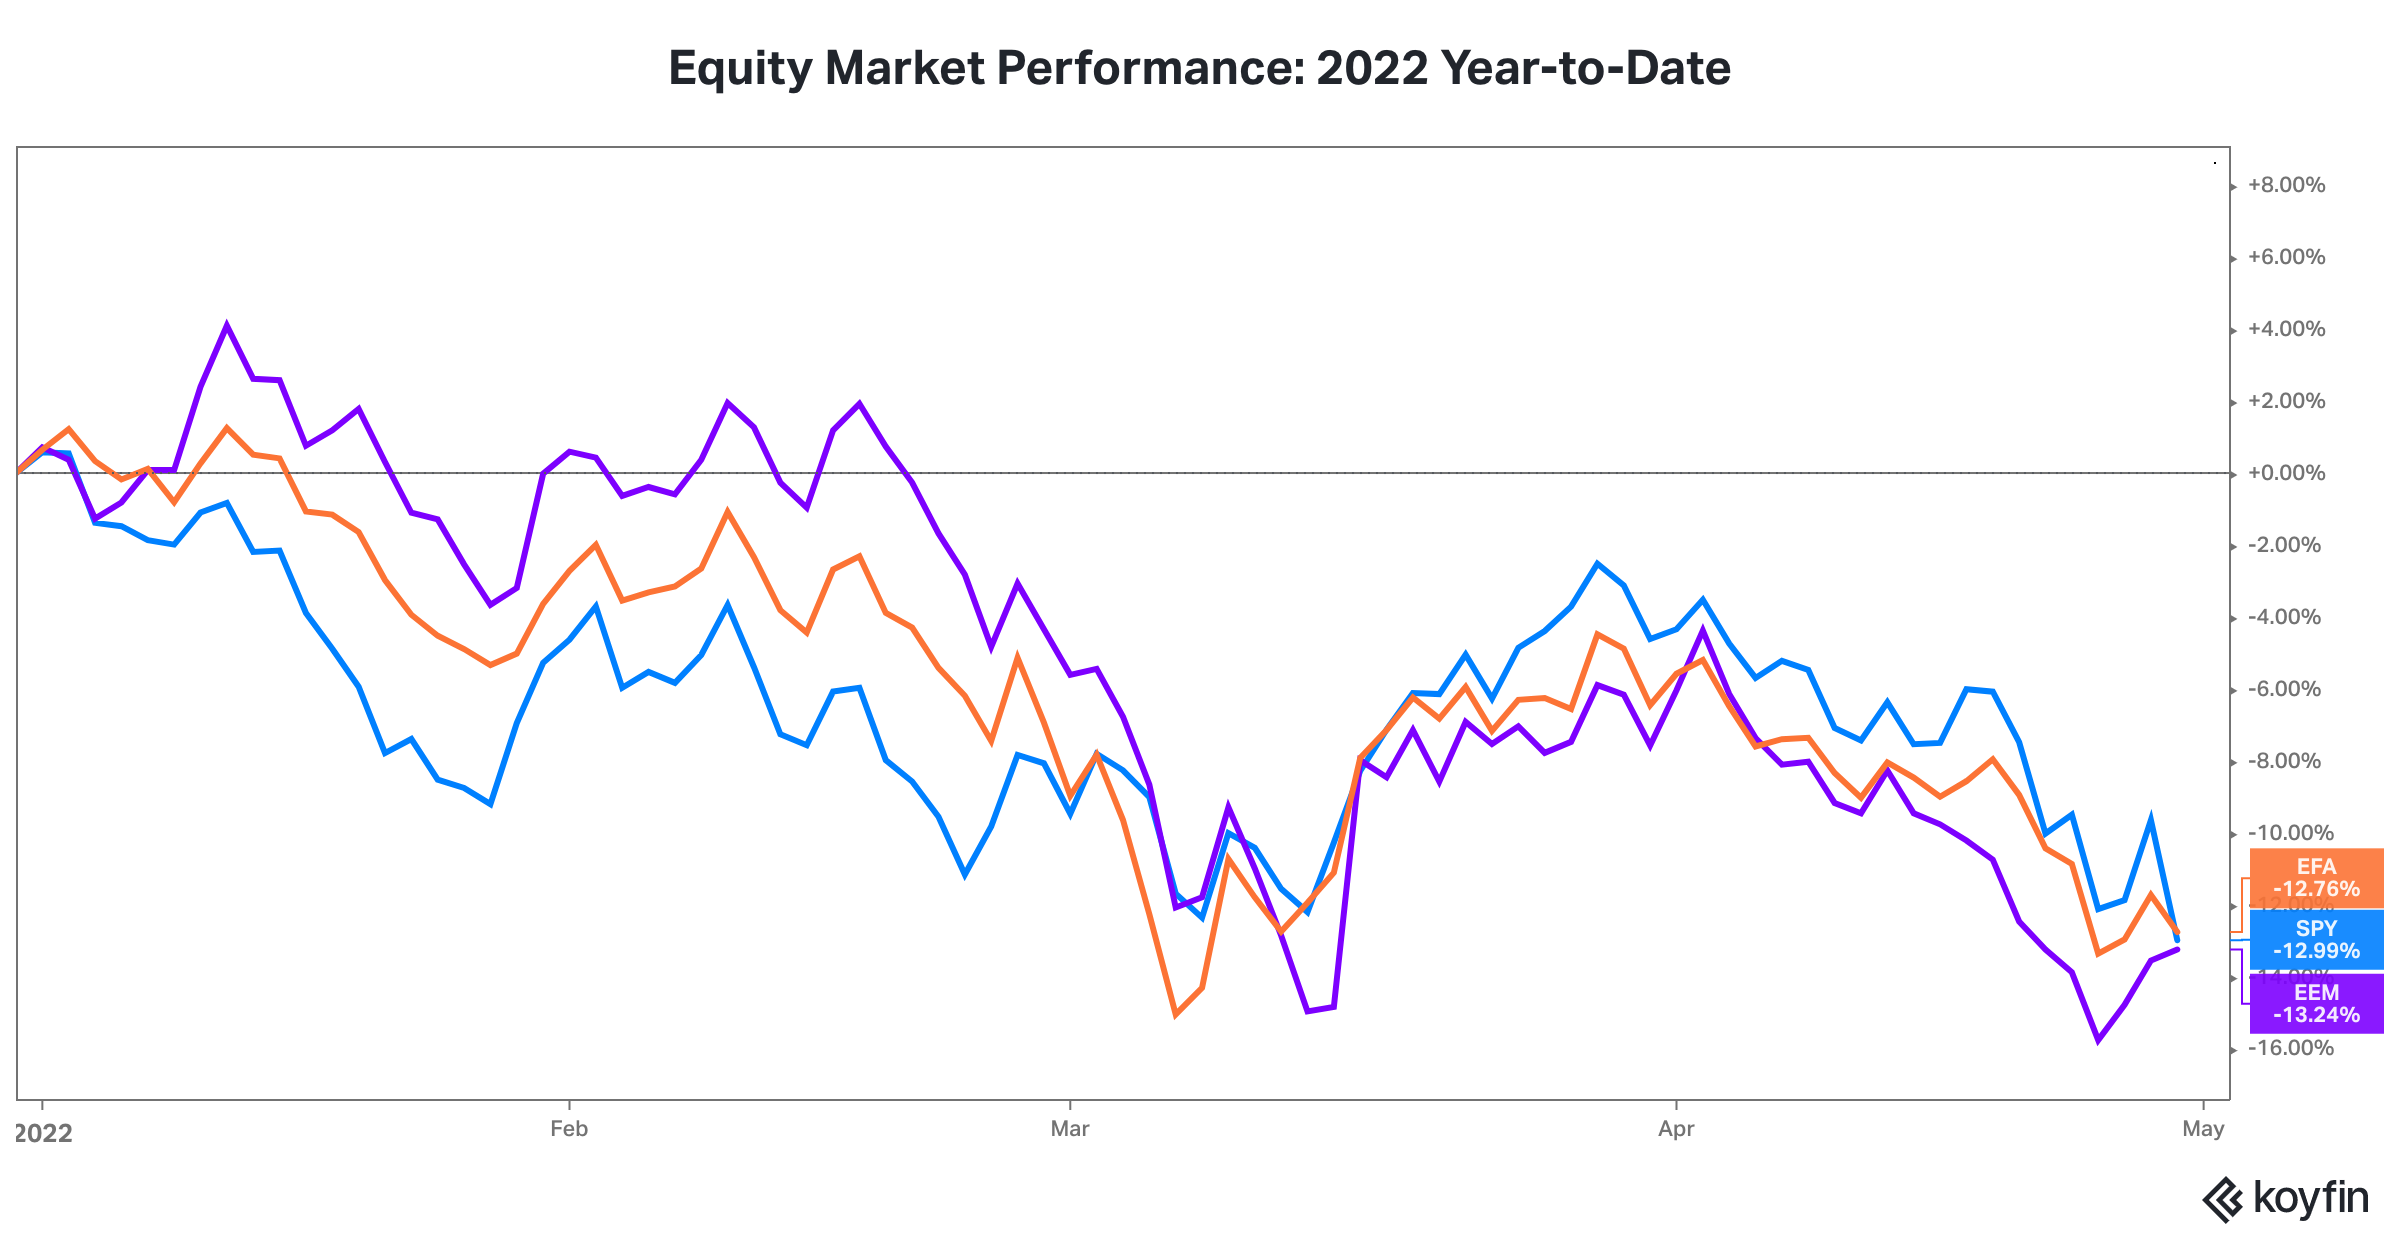
This chart shows the price performance of SPY (the SPDR S&P 500 Index ETF in blue), EFA (iShares MSCI EAFE ETF in orange), and EEM (iShares MSCI Emerging Markets ETF in purple).
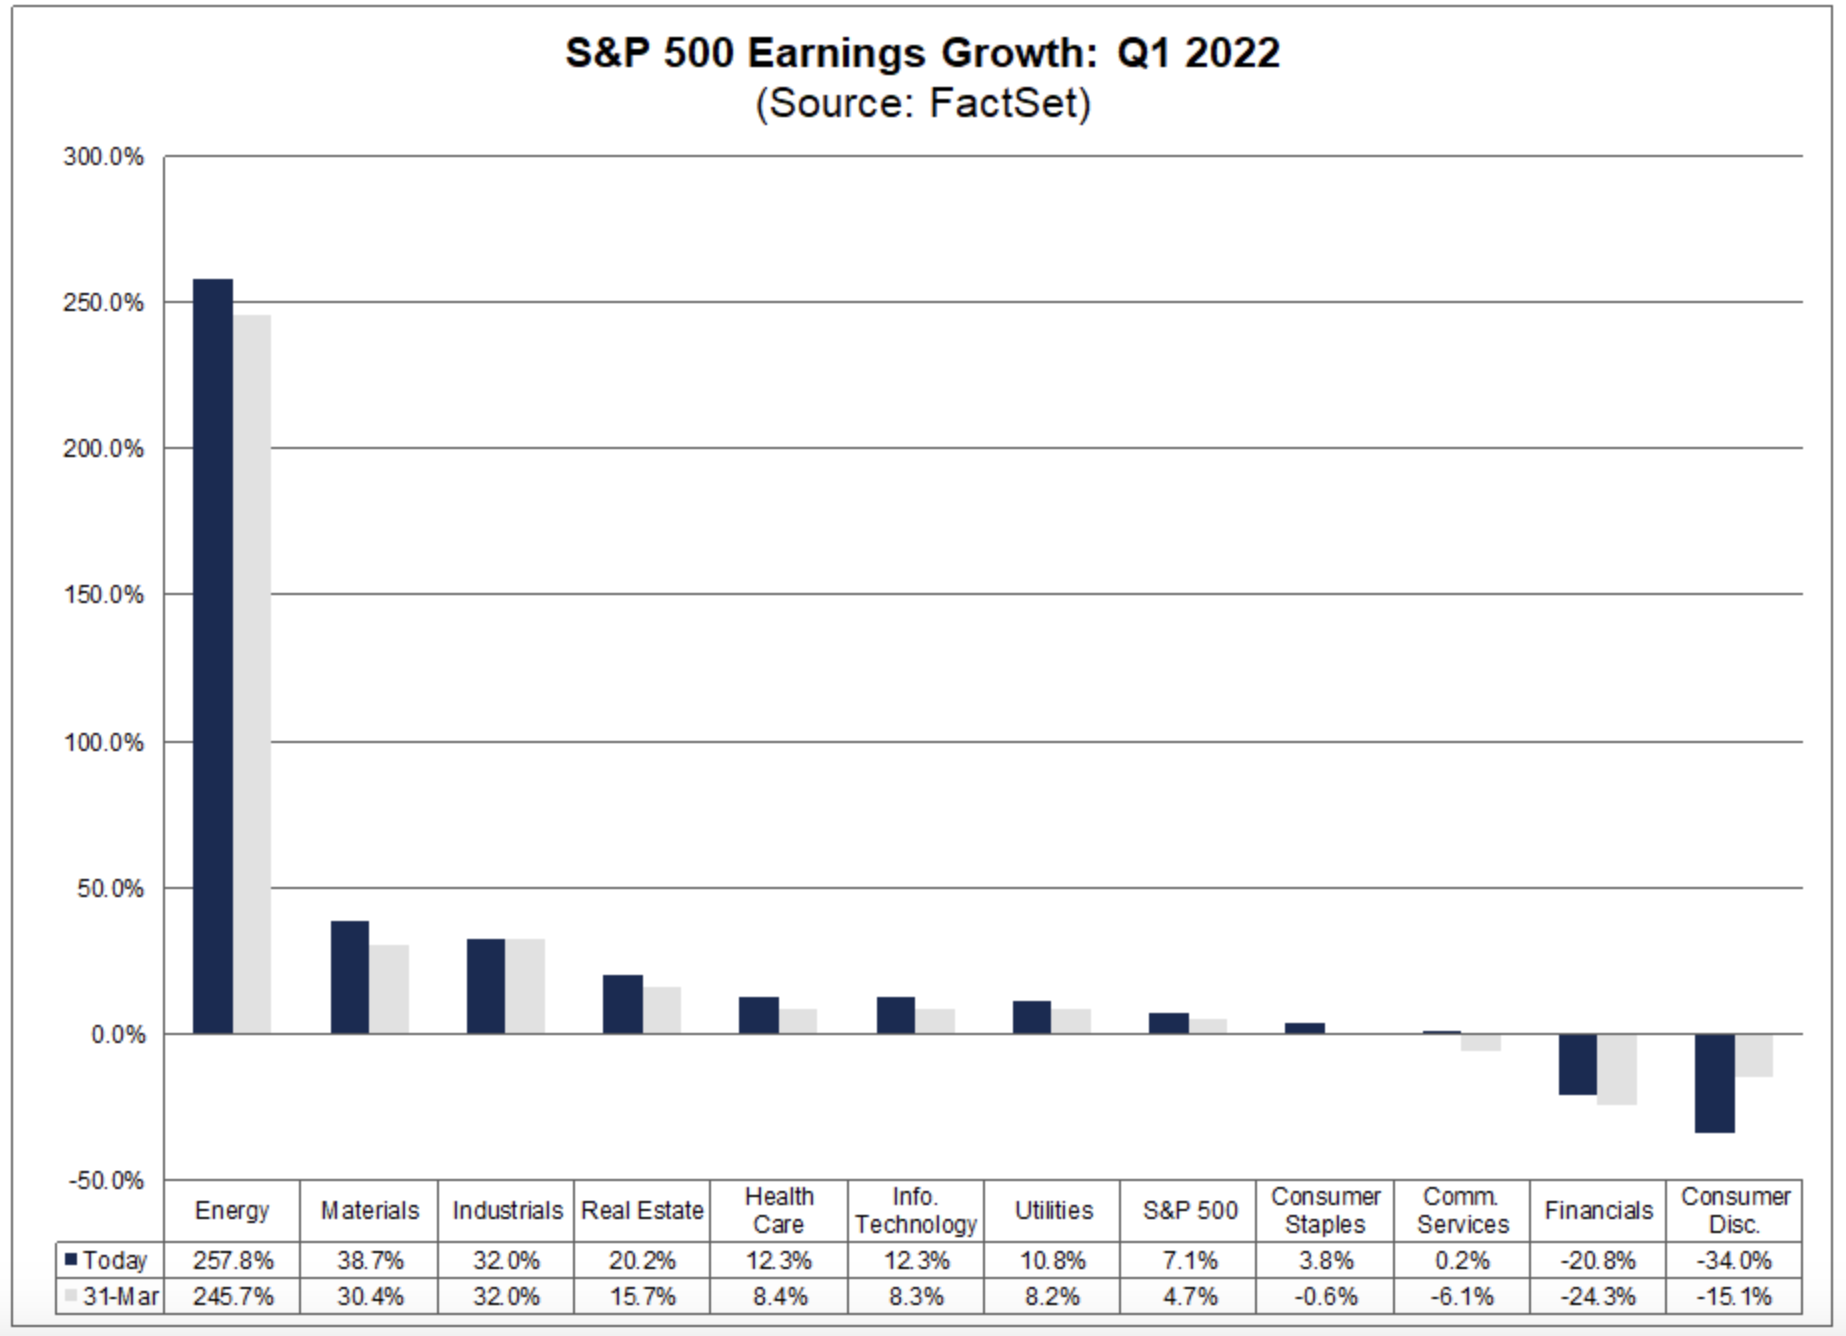
3. Halfway through 1q2022 earnings season, US corporate revenues look solid, earnings less so due to expense challenges. Going forward, solid earning growth is necessary to offset the impact of tightening liquidity on valuation multiples.
As of April 29, 2022, with 55% of the companies in the S&P 500 having provided earnings reports, revenue growth is up 12% and earning growth is up 7% year-over-year.
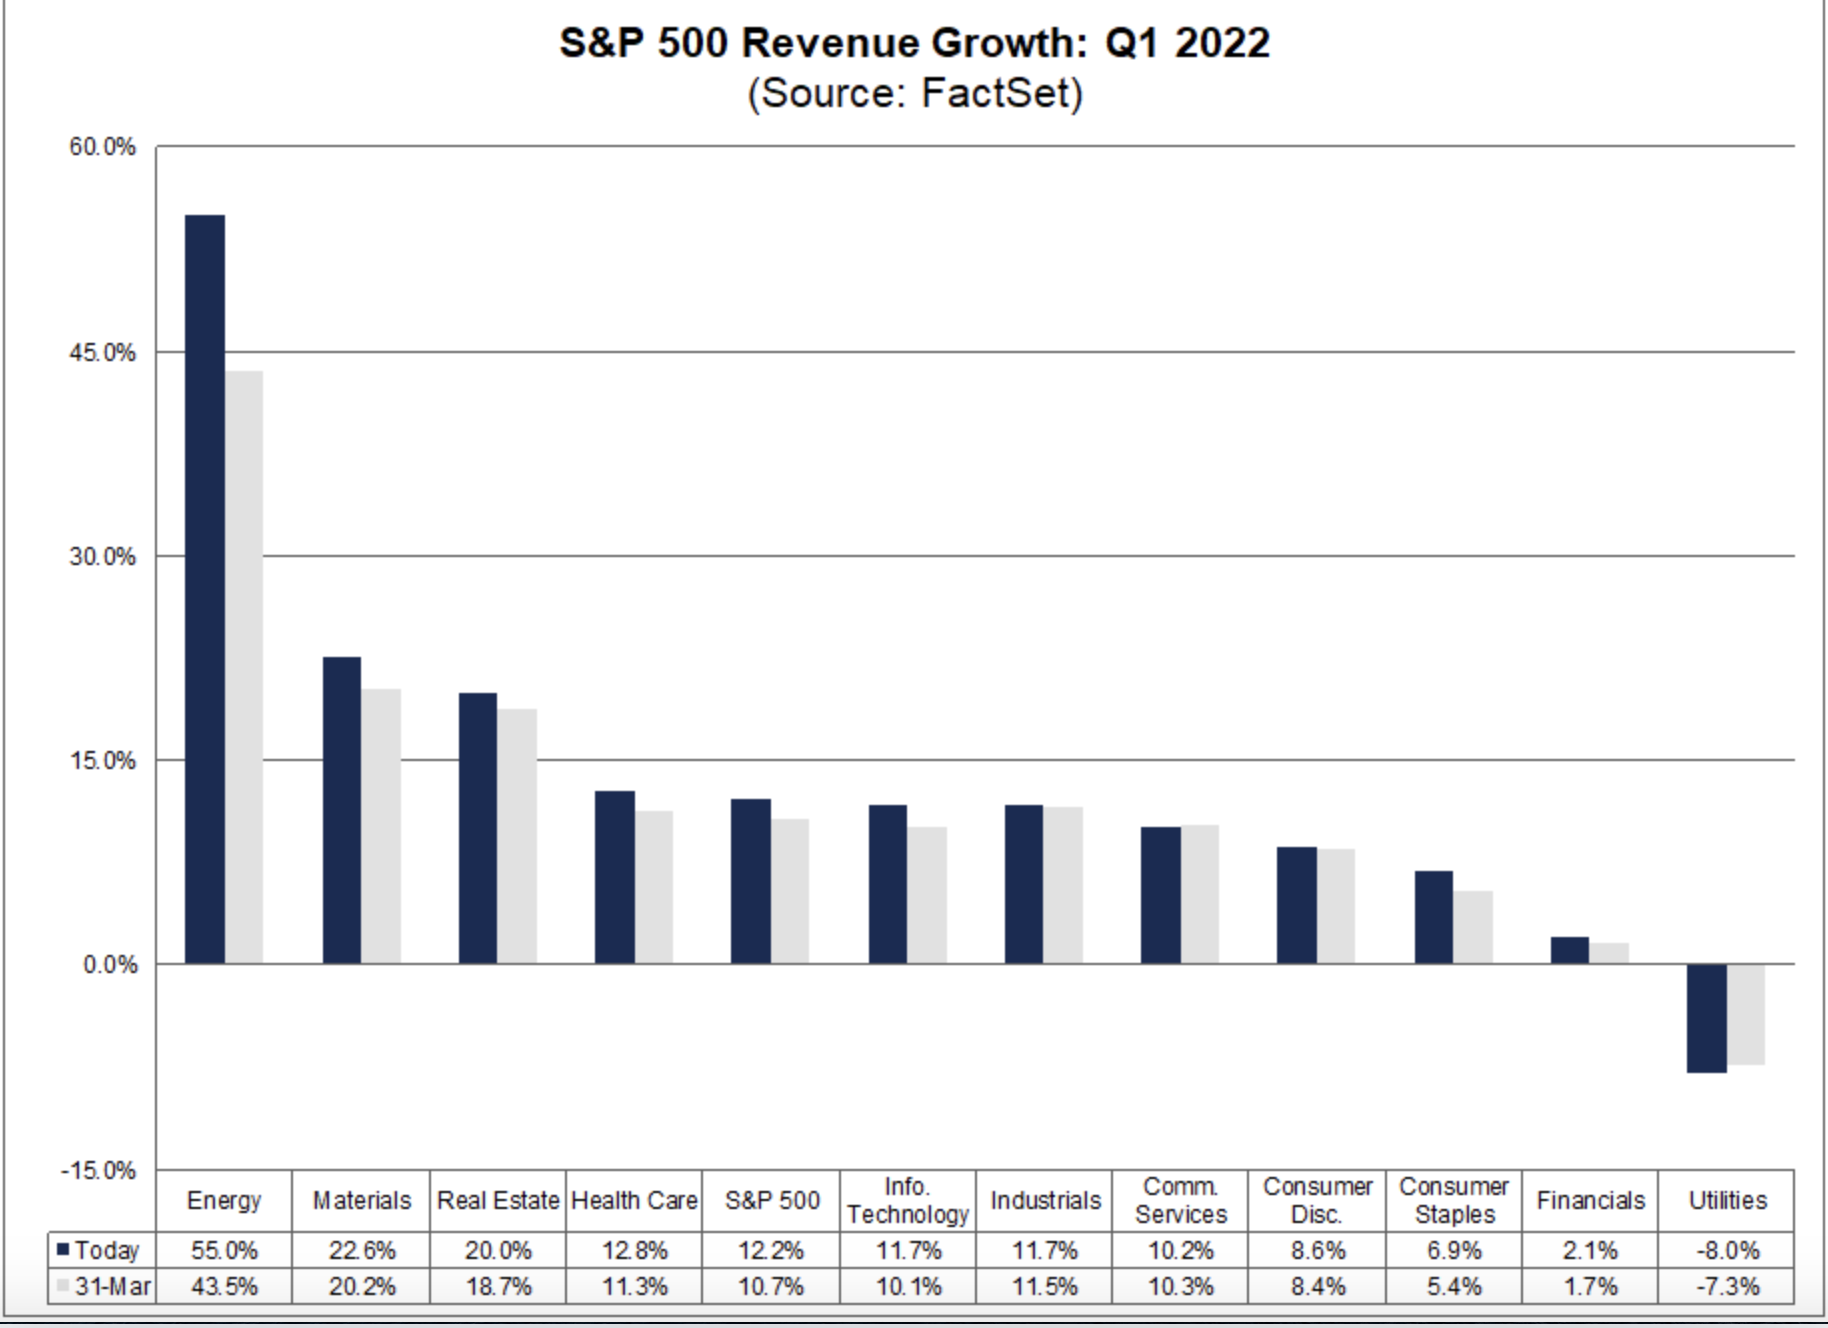
The energy sector has been the star performer. Financials and consumer discretionary bear watching as higher costs (inflation) have translated to lower profitability and negative earnings growth.
4. Mean reversion in asset valuations was going to happen at some point. More volatility was inevitable as the stability from a long period abundant central bank liquidity likely induced complacency and excessive risk taking in some areas of the financial markets. A higher baseline level of volatility is healthy. That said, we are cognizant too sharp a reduction in liquidity could induce something more ominous. We are monitoring several items, including continued USD strengthen versus other major currencies, reduced trading liquidity depth, volatility spikes, and credit spreads.
The US dollar has rapidly appreciated versus the Yen, Euro, and Yuan. The Fed is implementing an aggressive monetary tightening program while the central banks in Japan and China have embarked on monetary easing programs. The concern is a shortage of USD, associated with USD strength, will constrain global economic growth since the USD is the world’s reserve currency and dominates global trade and finance.

This chart illustrates the recent rise of the USD vs. the Yen, Euro, and Yuan.
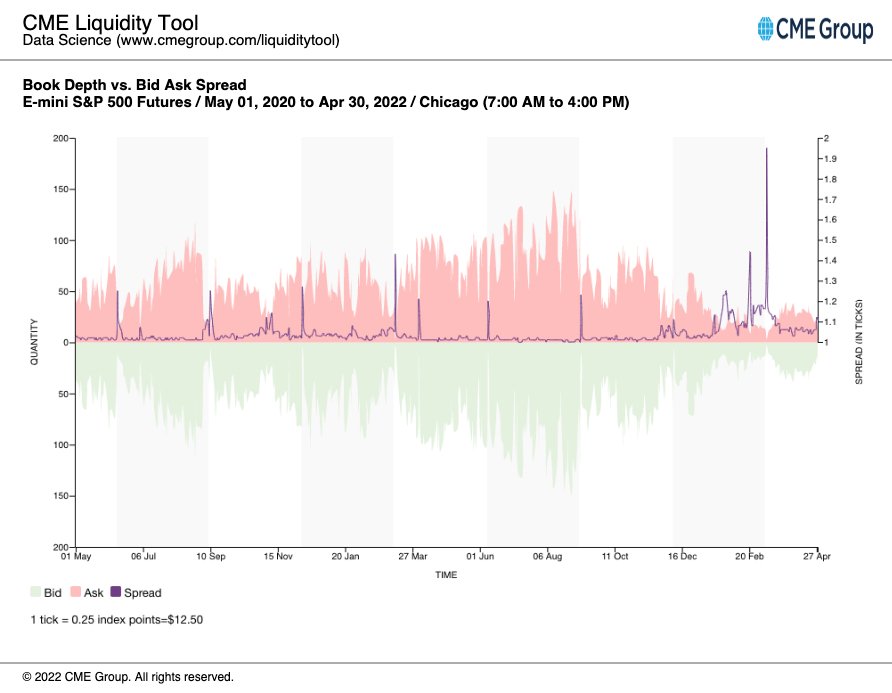
A reduction in trading liquidity can foreshadow a reduction in risk taking among financial market participants. Both Treasury Note Futures and Equity (e-mini S&P 500) Futures have recently seen a large decline in the depth of orders.

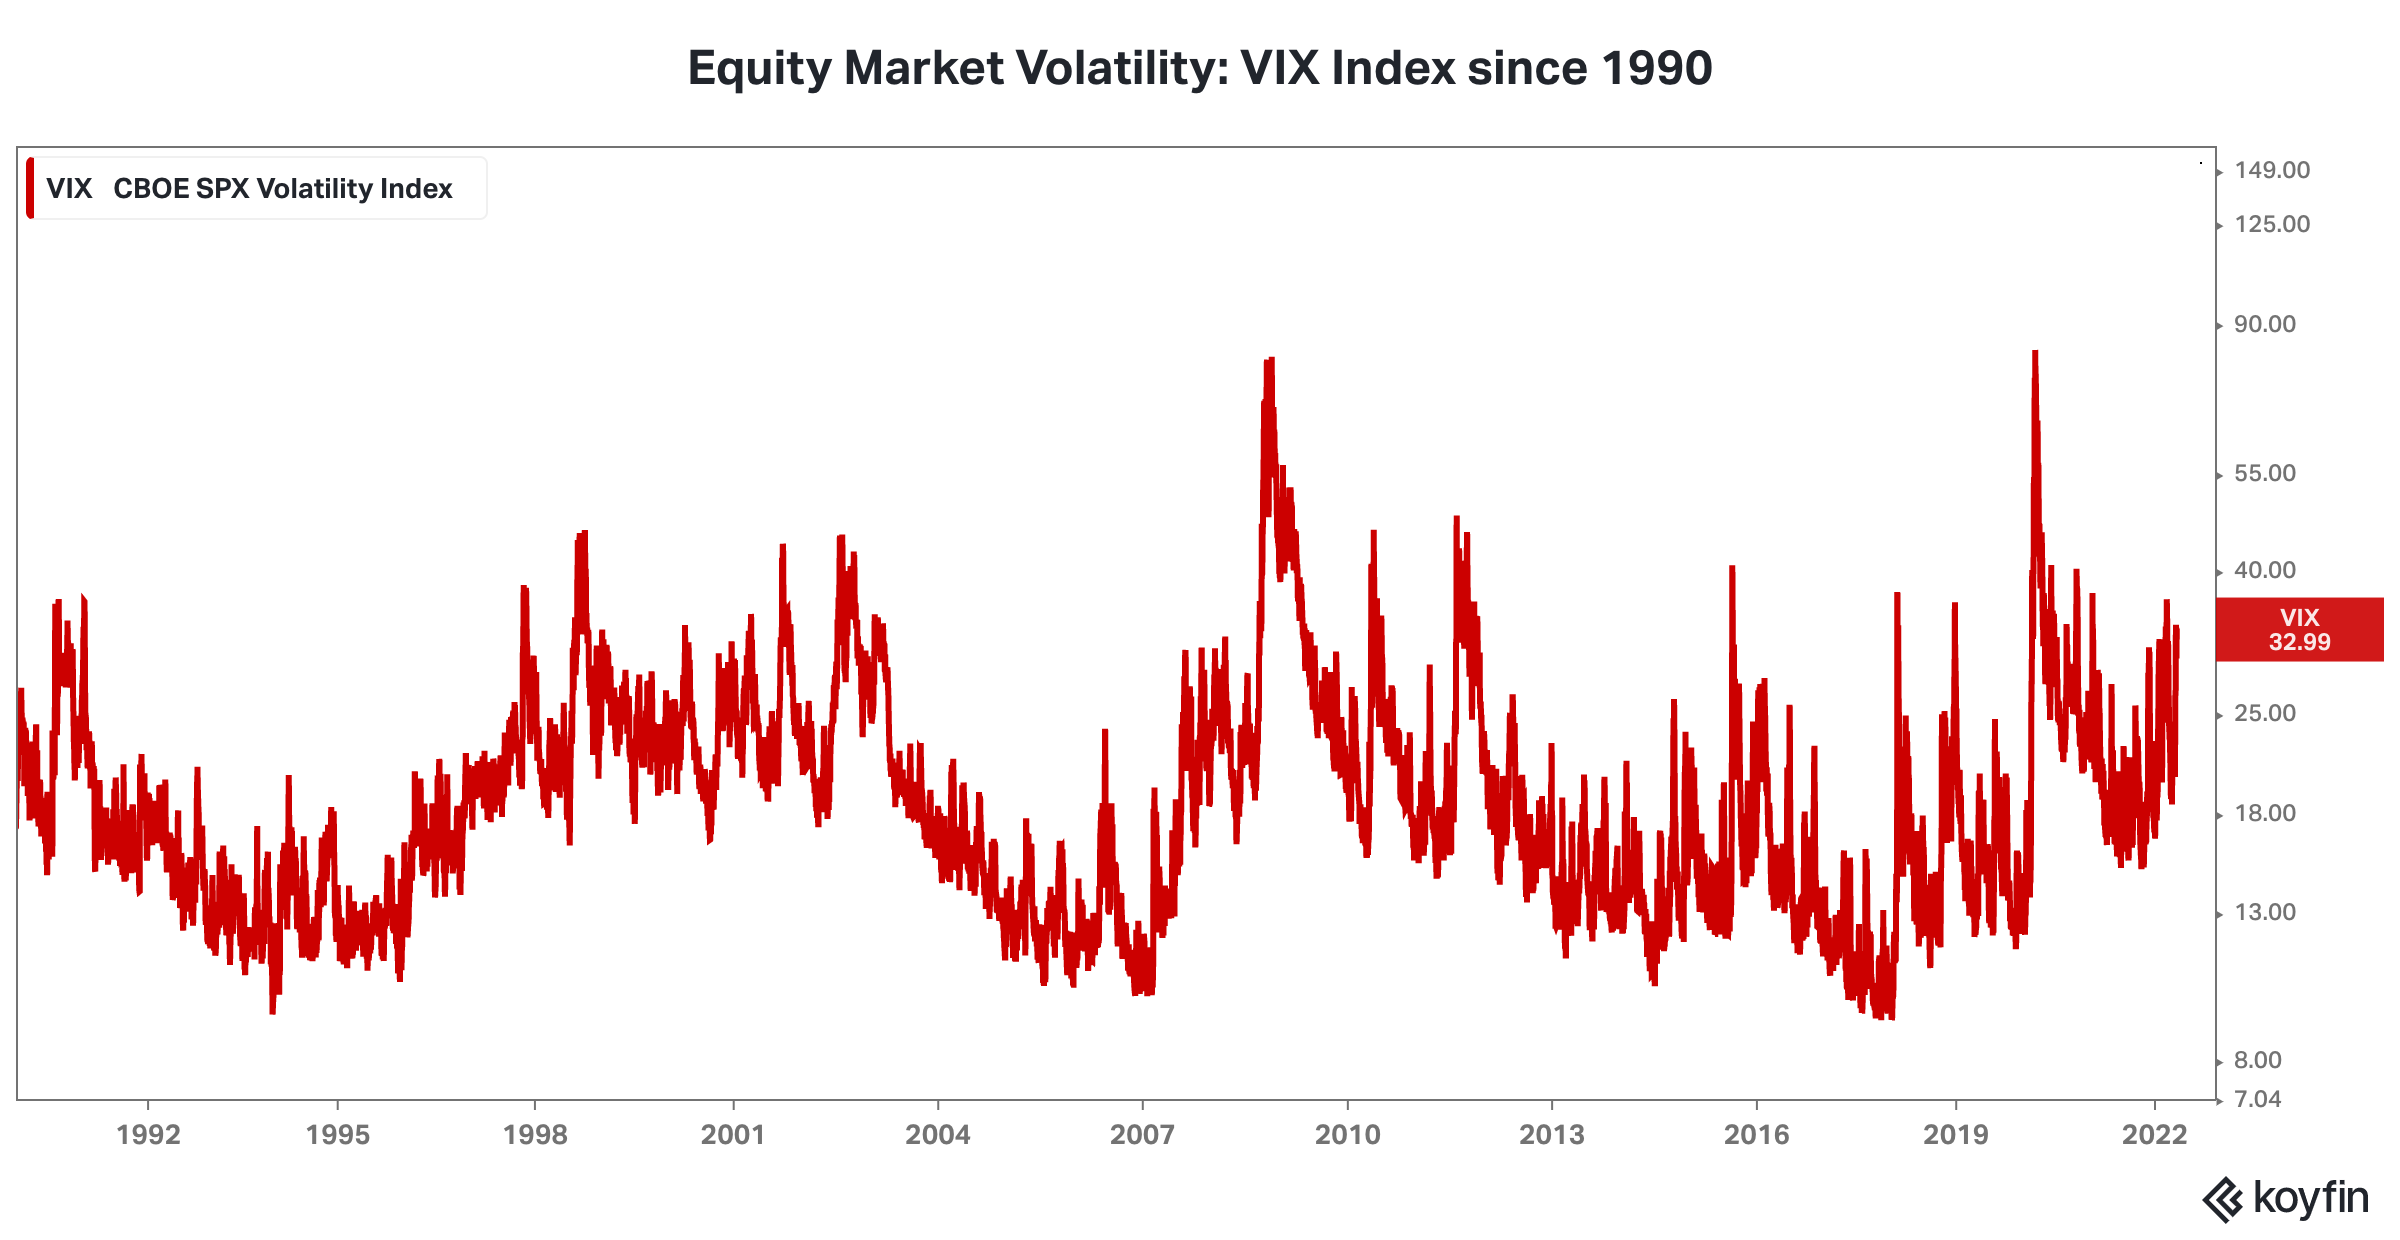
Equity volatility has risen in an orderly fashion and remains below levels historically associated with crises.
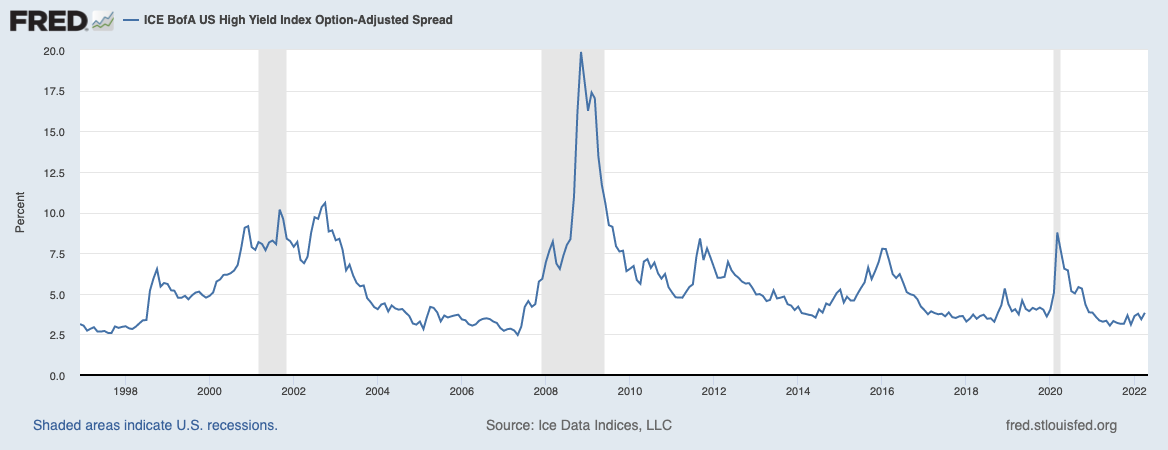
Credit spread have ticked up, with high yield spreads approaching 400 bps. However, they remain well below levels historically associated with crises.