VALUE and MOMENTUM OBSESSION
As a quant, I have been obsessed with systematic Value and Momentum since the first day I ran a backtest.
Part of me knows that the future for this combo is unlikely to be as good as the past. In my R&D, I moved on to other factors more than a decade ago. But another part of me is still in love with the magical duo and wishes for them to survive. Value and Momentum have been the most beautiful market phenomena out there and I will feel sad in a world without them.
We recently discussed the risk side of things. And the risk side of Value-Momentum is alive and well.
But what about the return? Will they earn a return over the next two hundred years as they have done during the past two hundred? Or have active managers delivered on their self-proclaimed value-add to society by removing this market inefficiency?
Is the very long history presented below evidence that Value-Momentum’s power is eternal, or is it reinforcement of their “unprecedented” recent decay? Is two centuries of data a memorial or a source of hope?
Prior Research
Overall, long-run factor research has been growing nicely during the past decade. Specifically for Value and Momentum, inspired by this blockbuster paper, we constructed original multi-asset extensions here, to be later confirmed and presented more comprehensively here.
For the stock-level value factor extension, see our prior blogs here and here.
For the original stock-level momentum extension, see here and here. But unlike our prior work, this is the first time we use total returns, instead of price-only returns. The number of stocks in this sample is significantly lower but return accuracy is likely to be higher.
For completeness, our original Value and Momentum extension in commodity futures is here and here, which recently and much more comprehensively was presented here.
To our knowledge, this is the first (very crude approximation) of U.S. stock-level Value and Momentum using total returns back to 1825. Thanks to the data from ICF @ Yale!.
RESULTS
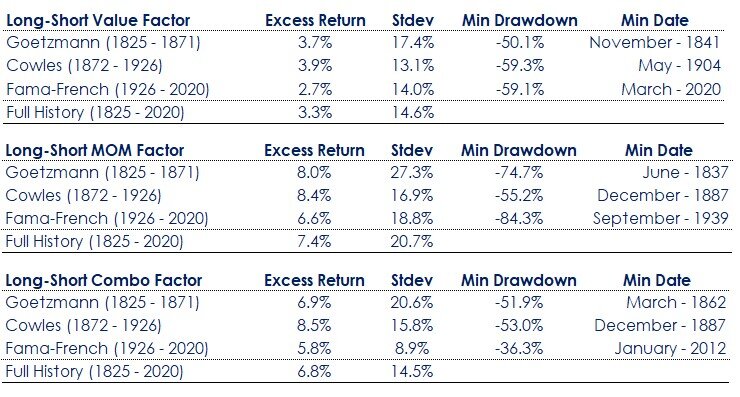
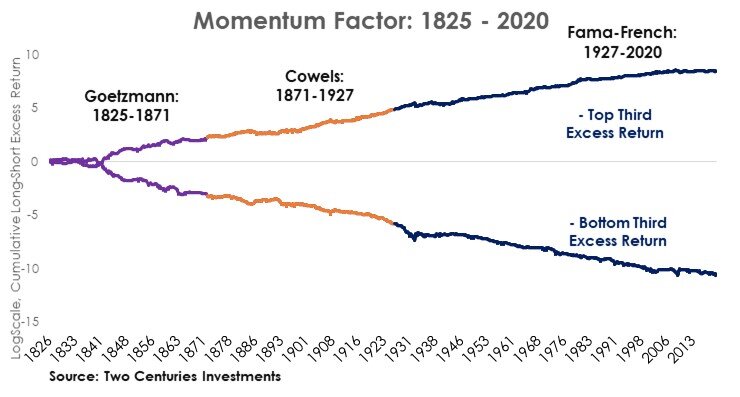
Download long-short VAL-MOM returns hereSource: Two Centuries Investments
Big Caveats:
Because the number of stocks in the early sample is very low, sometimes resulting in portfolios that are long 1 stock and short 1 stock, these results are just “illustrative” of how things could have been rather than an accurate representation of what actually happened. In addition, there are a couple two year periods where the prices are missing all together. Overall, there is just enough data to say “there is ‘something there’ to Value-Momentum in this previously untested century” rather than how it actually was.
From the investment perspective, such “illustrative” approximation is in the conservative direction, if anything, over-stating the factor volatility and drawdowns.
Future improvements to these estimates will most likely result is a different looking set of returns and drawdowns.
In the end, everyone individually needs to decide if these results can make them better factor investors. If not, they should be discarded.
Take-aways:
Obvious to readers of this blog, we believe long-run history is vastly under-appreciated.
Long-run history could have produced more realistic factor expectations and decreased the recent factor drawdown surprise.
Improving the quality of long-run historical data would at the very least make for some exciting academic documentation of the two most incredible market inefficiencies ever.
Many international equity markets have started another century or more before the U.S. This ultra long history can shed more light on the nature of Value and Momentum such as documenting conditions under which they work best.
I do not think this is Value and Momentum good-bye.
Looking at Momentum crawling its way out of the very deep 2009 drawdown can make one believe that a comeback for Value is possible too.
Both Value and Momentum have crawled out of even deeper drawdowns in the past.
While I chose to see the long-run history as a source of hope for traditional factors, I have more tempered expectations than I would have had using only the data from the second half of twentieth century.
The recent flatness of the cumulative graph is starting to become alarming relative to the extra long-history. For example, the current drawdown in the Value-Momentum is the longest that it has ever been (136 months vs prior longest of 116 months).
While we wait for Value-Momentum comeback, I see a vast amount of other promising opportunities, see some thoughts here and here.


