
Here is a meta-analysis of market developments, along with our insights.
1. Companies are facing unprecedented supply chain issues. Because “the global supply chain” is akin to a meta chain, with many local chains, these issues require more coordination to resolve. They are currently the biggest risk to the equity bull market.

As Morgan Stanley noted recently, company managements are citing supply chain constraints as limiting business operations and detracting from financial performance. Financial markets are accustomed to a combination of the Federal Reserve, government expenditures, software, and intangible assets (the basis of our equity strategies at Two Centuries Investments) solving crises and boosting economic activity.
The Fed can unclog the credit arteries of the commercial banking system as it did during the 2008 Financial Crisis. Congress can boost demand (akin to faster blood flow) with massive spending programs as it did in 2020. Software (akin to the nervous system) can be designed to increase productivity by maximizing the capabilities of computer hardware. Intangible assets (akin to the brain) help drive innovation, sustain revenue growth and profitability, and reduce risk.
Unfortunately, the global supply chain is more fragile due to its complexity, lack of redundancy, and feedback loop dependencies. It is analogous to a meta chain with many sub (local) chains. It will take a concerted effort by the Biden Administration, the global shipping industry, federal and state regulators, and US businesses, especially US transportation companies, to coordinate and compromise on rules, regulations, and incentives for the supply chains issues are to be resolved in the near future.

Source: MarineTraffic, October 30, 2021. Green icons represent cargo vessels. Blue icons represent tugs and special craft.
In the meantime, bottlenecks will remain. Probably the most discussed bottleneck is the ongoing congestion shown above at the port system of Los Angeles and Long Beach, the ninth largest port in the world. Approximately half a million containers full of goods remain idled off shore as we discussed last month (October 2021 Market Update).

Source: FreightWaves
How did this happen? The immediate cause was a large increase in the demand for goods. However, a shortage of physical space (warehouses, storage yards), equipment (chassis, trucks), and labor (truck drivers, port workers) largely driven by rules, regulations, tariffs, incentives, and past underinvestment has created bottlenecks, which have led to a series of negative feedback loops.
For instance, zoning rules in Los Angeles and Long Beach limit the truck yards to stacking empty containers to two containers high. Chassis, which are trailers used to offload containers from ships and then transport them, are currently being used to store empty containers, since there is no available yard space. Building more chassis takes time, and is futile if the materials needed for chassis construction are not available because of…you guessed it, supply chain issues. To make matters worse, at the request of ocean carriers, up to 2,000 empty containers originating from the ports of Charleston, South Carolina; Savannah, Georgia; New Orleans and Houston were headed to the Port of Los Angeles or Port of Long Beach to be loaded onto vessels headed to Asia.
The ports of Los Angeles and Long Beach are local chains in the meta global supply chain. When a few chains experience hiccups, the issues multiply because of negative feedback loops, and the meta chain malfunctions. The breadth of the problems span many local chains and was well articulated by the Institute of Supply Management (ISM) its September 2021 Manufacturing Report On Business®. The ISM noted “All segments of the manufacturing economy are impacted by record-long raw materials lead times, continued shortages of critical materials, rising commodities prices and difficulties in transporting products.” Without a quick resolution, companies face higher costs and in some cases lower revenues, jeopardizing profitability.

Source: S&P Global. This chart shows operating profit margins for the S&P 500 Index on a quarterly basis.
Equity markets have enjoyed an extended bull run in part due to rising profit margins, which expanded to all time highs at the end of the second quarter 2021. A decline in operating profit margins, at a time when valuations are at peak levels and there is chatter about monetary policy tightening, will weigh heavily on near term equity market performance.
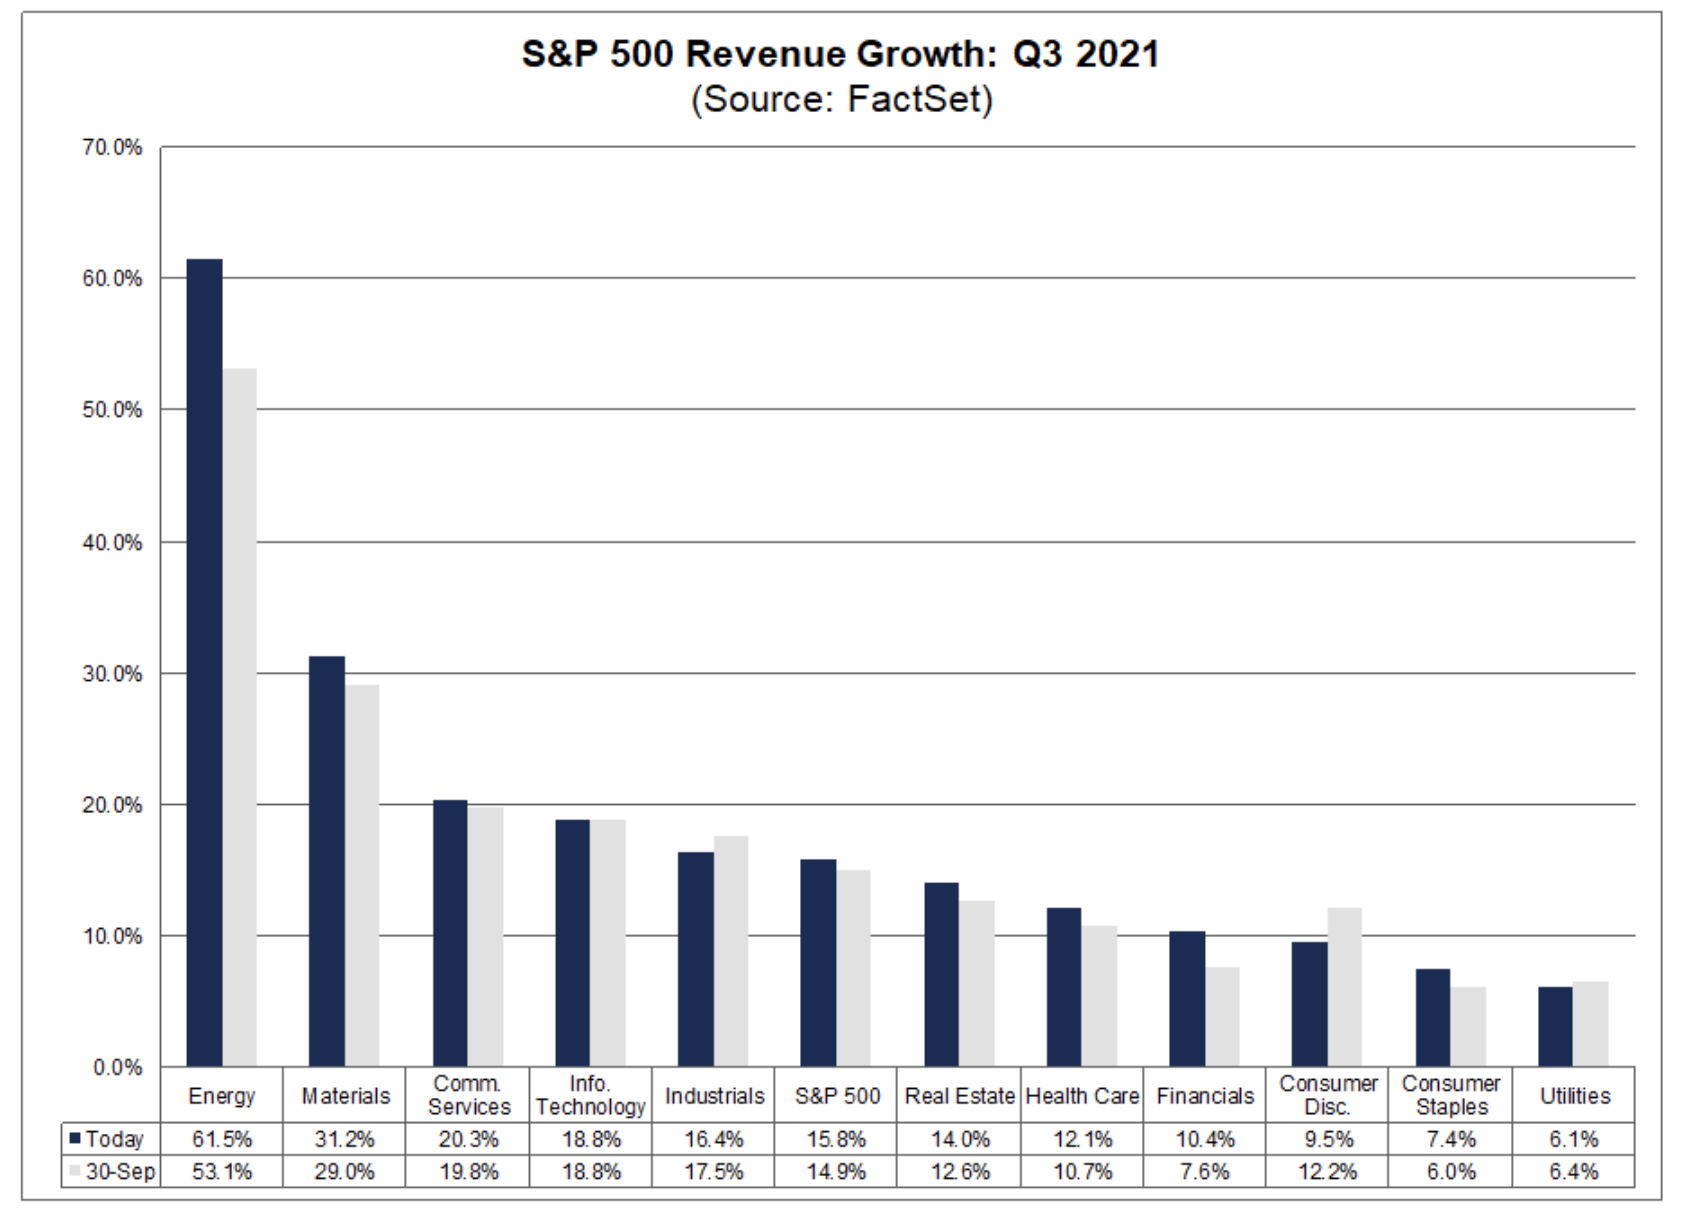
2. Growth in corporate revenues and earnings remains strong, but year over year comparisons are becoming more difficult and supply chain constraints are starting to make an impact.
Thus far in the third quarter, with 56% of S&P 500 companies reporting, revenue growth is up 16% and earning growth is up 37% year-over-year. The problem is management teams are signaling rough waters ahead and have offered disappointing earnings guidance because of supply chain issues.

3. Equity sector performance in October and year-to-date highlights the rebound in two of the most economically cyclical sectors and the underperformance of the two most defensive sectors.
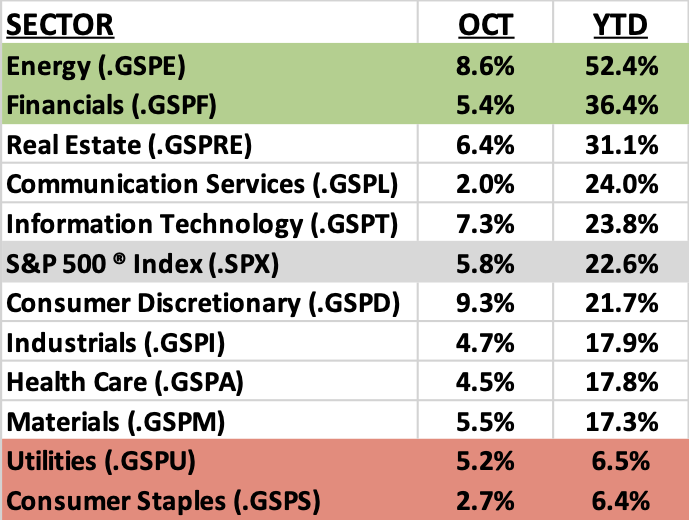
Source: Fidelity. This table shows the returns for the 11 sectors of the S&P 500 Index for the month of October and year-to-date through October month end.
4. Oil prices continue to soar, but natural gas prices in Europe and Asia are the near term concern for the global economy and equity markets.

This chart shows the price of a barrel of WTI crude oil over the 12 months ending October 29, 2021.
The price of WTI crude oil rose another $8 in October and has risen an outstanding 130% over the last 12 months. As we explained last month (October 2021 Market Update), the underinvestment by publicly traded energy companies in oil exploration and production over the last several years has made oil supply relatively inelastic in the short term.

Source: FRED Economic Data courtesy of the Federal Reserve Bank of St. Louis. This chart shows the price of natural gas in the European Union, quoted in USD and on the same heating unit basis as US natural gas price quotes. The data series ends on September 1, 2021.
Of bigger concern is the rise in natural gases prices globally. Natural gas is a local market unlike the crude oil market. The US is the least impacted by rising prices as it is the low cost producer of natural gas globally. For comparison purposes, on September 1, the US price of natural gas (Henry Hub) was $4.62 per Million Metric British Thermal Units (mmBtu). The European price was almost 5 times higher at $22.09 per mmBtu. On October 29, the US price had risen to $5.54 per mmBtu while the European price had declined below $20 per mmBtu. The high cost of natural gas in Europe will impact electricity prices, reducing disposable income for households and cutting profit margins for manufacturing businesses.
5. Higher energy prices and the debt crisis at Chinese property developer Evergrande are testing the resiliency of China’s financial system and economic model. The US and China have been the world’s engines of growth for the last two decades. We are monitoring China closely.
China has not been spared by the spike in global energy prices. In mid-October, the Chinese government allowed power suppliers to increase industrial tariffs by 20% for all customers and by an unlimited amount for energy-intensive customers. Higher energy prices will reduce retained profits, a big source of funding for manufacturing capital spending. Normally debt financed capital spending would be an alternative, but China’s credit growth continues to slow. The property market, and associated infrastructure investment, remain under pressure due to a debt crisis hitting a few of China’s largest property developers, particularly Evergrande, the largest by sales. The real estate industry and industrial sector contribute around 50% of China GDP, according to some estimates. Any significant haircut to China’s economic growth will have large implications for global economic growth, and by extension, global equity markets.