
1. The composition of the U.S. equity market performance in January qualifies as one of the stranger things I have seen in my career.
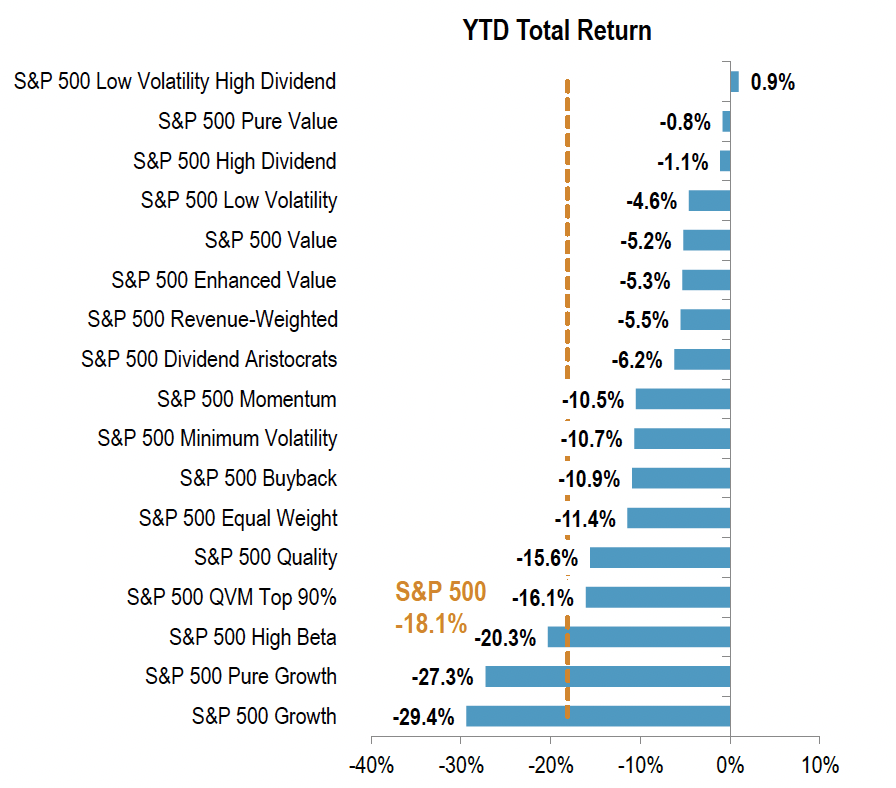
In January, the U.S. equity market market rose 6.3% (as proxied by the S&P 500 Index). I wasn’t surprised risk assets started the year with a strong upward bounce as the U.S. equity market declined 18.1% in 2022. Nor was I surprised high beta stocks outperformed low volatility stocks after underperforming low volatility stocks by 15.7% in 2022, though the degree of outperformance, by 19.3%, was a bit surprising. Some mean reversion was likely for both the market overall and for underlying equity factors. Risk on.
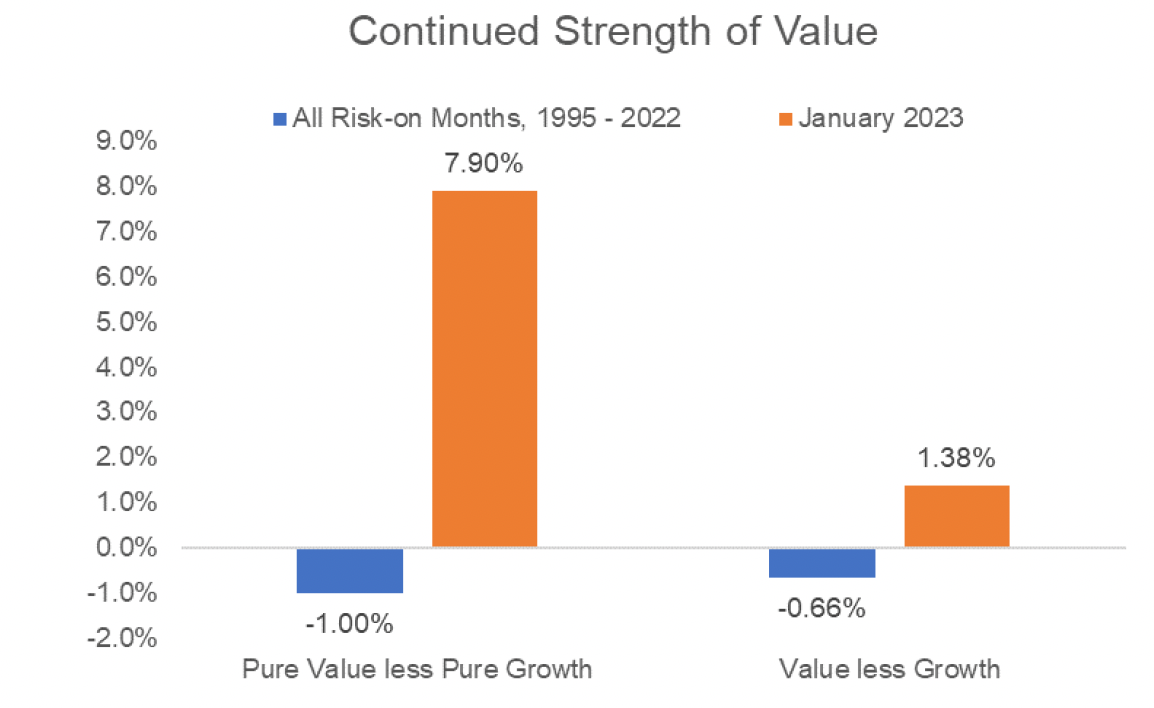
What was “Upside Down”, given the aforementioned mean reversion in both the overall market and high beta vs. low volatility, was the lack of mean reversion in the performance of growth stocks vs. value stocks. Growth underperformed Value by 1.4% in January after underperforming by 24.2% in 2022. Pure Growth did even worse on a relative basis, underperforming Pure Value by 7.9%.

Source: S&P Dow Jones Indices LLC. This chart shows equity factor performance in January 2023, using the S&P DJI factor methodology.
Source: S&P Dow Jones Indices LLC. This chart shows equity factor performance for the calendar year 2022, using the S&P DJI factor methodology.
Even stranger was the growth vs. value performance when considering history. Value stocks typically underperform growth stocks in risk on markets. January 2023 was definitely an anomaly, especially for pure value vs. pure growth. A supernatural force at work?
Source: S&P Dow Jones Indices LLC.
2. January was a banner month for all major asset classes.

This chart shows the price performance of SPY (SPDR S&P 500 Index ETF in purple), EFA (iShares MSCI EAFE ETF in blue), EEM (iShares MSCI Emerging Markets ETF in orange), GLD (SPDR Gold Trust ETF in dotted yellow), HYG (iShares iBoxx USD High Yield Corporate Bond ETF in dashed light blue), TLT (iShares 20+ Year Treasury Bond ETF in dashed light blue) and IEF (iShares 7-10 Year Treasury Bond ETF in dashed red.)
3. Inflation as measured by CPI-U may be moderating, but businesses are still dealing with cost pressures that have resulted in earnings declines despite revenue growth.
With 50% of S&P 500 companies having reported earnings as of February 3, year over year revenue growth is estimated to be a modest 4.3%. However, earnings are estimated to decline 5.3%. Only the energy, industrials, and real estate sectors are showing both revenue growth and earnings growth.


4. The paths forward for the U.S. equity market and the U.S. economy remain encased in heavy fog, a view introduced in last month in our 2023 year ahend outlook commentary.
From my perspective, the two debt market charts below encapsulate the divergent messages being sent to investors.
The Treasury yield curve remains inverted, and is even more inverted than it was at year end. Interest rates, via the inverted yield curve, are signaling economic weakness and maybe even deflationary pressure is on the horizon.

Source: treasury.gov, Two Centuries Investments
On the other hand, the credit markets remain sanguine. High yield credit spreads fell 51 basis points in January, are 120 basis points below their most recent peak at the end of September, and are 169 basis points below their 2022 peak in early July.
Credit markets are signaling the U.S. economy is weathering the large and rapid tightening of monetary policy.

If credit markets are correct, the question will become at what level inflation settles. If the level is too high, the Federal Reserve will likely be forced to resume more aggressive monetary tightening. The risk of a policy error and an ensuing recession would become likely.
At this stage, we are monitoring for economic and financial market data for clues.