
Value investing is struggling big time!
As of March 2020, Value factor is down -51% from the peak reached 14 years ago. It is the longest and largest drawdown in value’s recent history. Many value investors have already rotated into growth. The remaining diehards also want to quit. Even Warren Buffett is selling.

Source: Professor French
Is value investing dead?
In the past, we took on this hard question through the lenses of innovation and expectations. Now, we summon another ally - Long Term History. We have turned to deep history before to learn about price momentum crashes, commodity future premia and risk parity. We now go back in time to learn about value crashes.
Part I: DID VALUE EVER CRASH like that BEFORE?
To answer this question, we extend the value factor back to 1871, adding 54 years to value’s history, which typically starts in 1926 with the Fama-French data.
We are able to go back in time thanks to the data collected by Cowles at Yale and Professor French at Dartmouth. Cowles provides monthly total returns and annual Earning-to-Price ratios for 68 U.S. Industries from 1871 to 1938. Professor French provides monthly total returns and annual Book-to-Market ratios for 49 U.S. Industries from 1927 to 2020.
We construct a monthly long-short value portfolio that goes long the top third of the cheapest industries and short the bottom third (the most expensive ones). We use Cowles data for the 1871-1927 period and French’s data from 1927 to March 31 of 2020.
[Side note: It is likely that these uncovered 54 years was a similar period that Benjamin Graham’s original backtests covered, according to this statement: “Graham said that his research suggested that this formula returned approximately 15 percent per year over the preceding 50 years” - source)]
Here is how it looks:

Graph shows log-cumulative long-short industry value portfolio return in excess of the risk free rate. The table shows total returns including the risk free rate. Sources: Cowles at Yale, Professor French at Dartmouth,Two Centuries Investments.

Graph shows drawdowns of the value portfolio return in excess of the risk free rate. Sources: Cowles at Yale and Professor French at Dartmouth, Two Centuries Investments.
Key Observations:
(+) Value returns are positive in the ‘previously untested’ 54 years of history, delivering 7.1% of total return per year.
(-) The drawdown graph re-confirms how painful the current environment is. From the peak in 2006, Industry Value lost -47%, which is worse than the famous Dot-com loss of -42%. In fact, the current loss is the worst we have seen in recent history - which is the only history that most investors have been looking at - leading them to question if value is indeed dead.
(+) Extended history reveals an earlier drawdown, similar in magnitude and duration to the one occurring now. It occurred at the turn of the last century and bottomed in 1904 with a -59% loss. Interestingly, it also lasted 14 years - exactly the same time as the current drawdown. Knowing that value generated a loss worse than the current one in the past, then recovered it, and then proceeded to earn positive returns for another century is reassuring. It’s likely that in 1904, similar to 2020, investors might have questioned whether value investing was dead. Conversely, it was the best time to get into it.
(-) On the other hand, it could get worse before it gets better. If value’s drawdown is to reach the historic bottom, then another -22% loss is possible. And of course, there is no assurance that the historical lows cannot be breached.
(+) We are not into calling bottoms or factor timing. But looking at history, it appears that a golden decade for value investing might be ahead. After reaching the bottom in 1904, value earned 9.99% per year above the risk free rate for the next 9 years, recovering its losses. It then continued to rally for another 7 years, earning 17.8% per year above the risk free rate.
Part II: How similar is Industry Value to Stock Value?
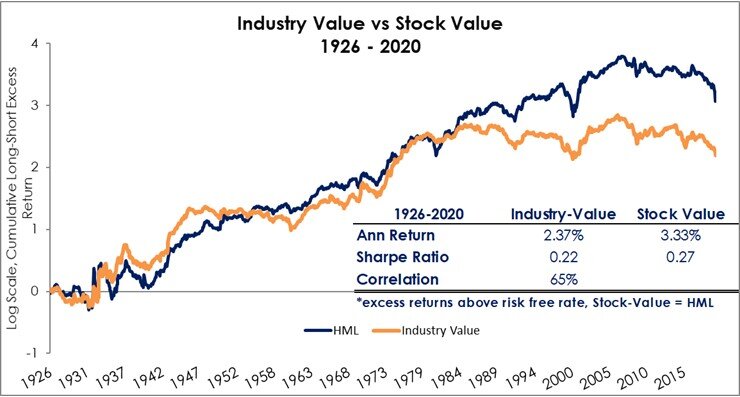
Both the graph and the table show long-short returns in excess of the risk-free rate. Sources: Cowles at Yale and Professor French at Dartmouth, Two Centuries Investments.
Surprisingly, it’s pretty similar - at least over the long-run.
From 1926 until 1982, the two versions track each other closely (which raises an important side question of whether simple HML-style stock value is captured by industries?)
During the 80’s and 90’s, the two strategies diverge in levels but their correlations remained high. For example, since 1926, their correlation is 65%, and their 3-year trailing correlation ending March 2020 is 72%.
Moreso, the return gap has been shrinking. For example, the 10-year annualized excess return for stock value is -5.9%, while industry value annualized -3.5%. At this rate, they might even converge again in the future.
Regardless of their less than 1% difference in long-run returns, for the purpose of drawing insights from deep history, the two strategies appear similar enough.
Part III: How Cheap is Value Relative to History?
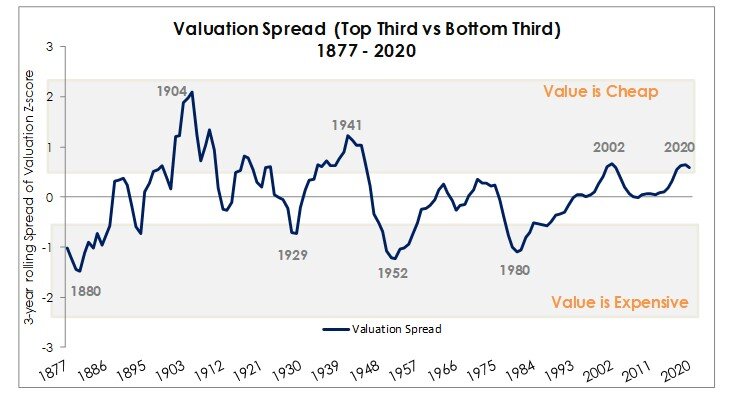
Graph shows 3-year average difference of z-scores for the top and bottom third portfolios’ cross-sectional valuation average.
In this graph, we measure how cheap the bottom third of industries are relative to the top third.
[Some caveats first - the above chart is built for attribution purposes, not forecasting, because the z-scores are computed using the full history. Also, the early history’s use of E/P and later use of B/M, even after standardization and smoothing (3-year rolling average), still leaves issues with comparability across the two time periods (before and after 1927). Finally, the cutoffs for cheap and expensive regions are just illustrative as they have been arbitrary selected at +/- 0.5 stdev level.]
Nevertheless, the cross-sectional value spread results align with time-series ones from Part 1. For example, 1904 was the year that value reached its cheapest cross-sectional and time-series levels. The Dot-com period also shows value’s cross-sectional cheapness. And most importantly, in 2020 value looks cheap again - on par with the Dot-com and only surpassed in recent history by the Great Depression decade.
Another similarity between now and 1904 is their shared “industrial revolution” growth regimes, which OSAM identifies as the turning points in Value’s performance. Our extended ‘out-of-sample’ data validates their hypothesis about the Third Turning point period.
In sum, based on cross-sectional spreads, value appears cheap.
Part IV: HOW TO hold on?
Value investors know that their approach is not for the faint of heart.
The path of a value investor is that of a contrarian. In addition to purchasing unpopular securities, value investors require patience, waiting years for the payoff. Cumulative return graph above shows how uneven the payoffs have been. The gains come in short spurts, and then bounce around from one drawdown to the next.
Some people make an argument that this uncertain path is the reason why value investors earn a premium, as compensation for all the pain. I question whether these are accurate statements. Lots of investments can cause pain, but don’t necessarily lead to returns. We have little theoretical grounding in finance to make such claims because most theory seems to break when applied to data.
Investors make up their own minds about why value investing works. Some believe it because of academic theory. Others because of the past successes of value investors. To some, value investing comes naturally and they don’t struggle holding unpopular stocks because they love the bargains. To others, value investing is a torture and they feel happier owning FANG stocks.
As for me, nothing is more convincing that the value effect is real and alive than uncovering half a century of new data and still seeing a positive long-run return with successful recoveries of even worse crashes than we see today.
In sum, if you are committed to value investing, craft a value style that works for you and find extra inspiration in these 25 Value Investing classics.
References:
Value is Dead Long Live Value by OSAM
Explaining the Recent Failure of Value Investing Lev and Srivastava
How Painful Can Factor Investing Get and Cheap vs. Expensive Factors by Rabener
Venial Sin Punished; Fact, Fiction, and Value Investing; Is Systematic Value Dead? by AQR
Factor Investing Fact Check: Are Value and Momentum Dead? by AlphaArchitect
Risk and Premium: A Tale of Value by GMO
Global Factor Premia by Baltussen, Laurens, van Vliet, Pim
Factor-Based Investing: The Long-Term Evidence Dimson, Marsh, Staunton
The Value Premium and the CAPM by Fama and French
Two Centuries of Value and Momentum by Geczy, Samonov Knowledge@Wharton