
Today’s quantitative investors seem split between innovation on one hand and engineering on the other. The prior group is constantly looking for new factors that predict returns in areas like alternative data and machine learning - yet often fail to find them. The latter camp is focused on investing in the more established factors such as value, momentum and quality, where long-term patience, conviction and execution seem to matter much more than innovation. So how did we end up here?
To explore the intriguing yet paradoxical interaction between “innovation factors” and “risk-premia factors”, let us turn again to the risk vs return dimensions of factor investing (mentioned last week here). This time, through the eye’s of the Barra risk model (for those unfamiliar, Barra makes one of the most well known risk models in quantitative finance).
PART I - The Simple Years (pre-2005)
Since the early 80s, traditional quantitative investing looked like this:
Step 1:
Find ‘Alpha Factors’ - characteristics that predicted a cross-section of stock returns and reflected some fundamental logic or perhaps slightly technical aspects like price momentum, combined into an overall proprietary stock ranking model.Step 2:
Build an Optimal Portfolio - by feeding the final rank from step 1, perhaps after some adjustments, as expected returns into an optimizer with a risk model, which was typically provided by a third party like Barra, Northfield or Axioma.
The first time I ran a Barra optimization backtest was in 2004 on a newly constructed model and as I looked at the performance attribution report, I didn’t know what I was looking for. What were the success parameters for the optimized strategy beyond the obvious one of information ratio?
But my boss knew what to look for. She ran many of these reports before, and this time around she was very excited. “Look at the size of the ‘Asset Selection’ return!” - she said. “This is great.”
‘Asset Selection’ is Barra’s terminology for alpha - the residual part of the return that could not be explained by their risk model.
At first, I was confused. Barra’s list of risk factors, which it calls ‘Risk Indices,’ included some of the same names as our ‘alpha factors’, like valuation and momentum. Didn’t we want the optimized portfolios to load on these? Why was it a good thing that most of our return came from ‘Asset Selection’ and not the ‘Risk Indices’?
My boss explained: “No. All those Barra factors are just risk. Clients don’t want them. They want uncorrelated alpha and there is no alpha in risk indices. You want to clean them out of your portfolio, which is what the optimizer tries to do anyway”. (Over time, this view proved to be both right and wrong. She, as most other traditional quants, were wrong in thinking that client's wouldn’t want to invest in risk factors directly. This caused many traditional quants to completely miss the current factor investing boom [but more on that later]. However, she was right that the uncorrelated alpha lives beyond those risk indices.)
The image below is a typical summary view of the Barra attribution report that we would look at. Maximizing row #9, while minimizing all other rows, was the objective of the original quant game.
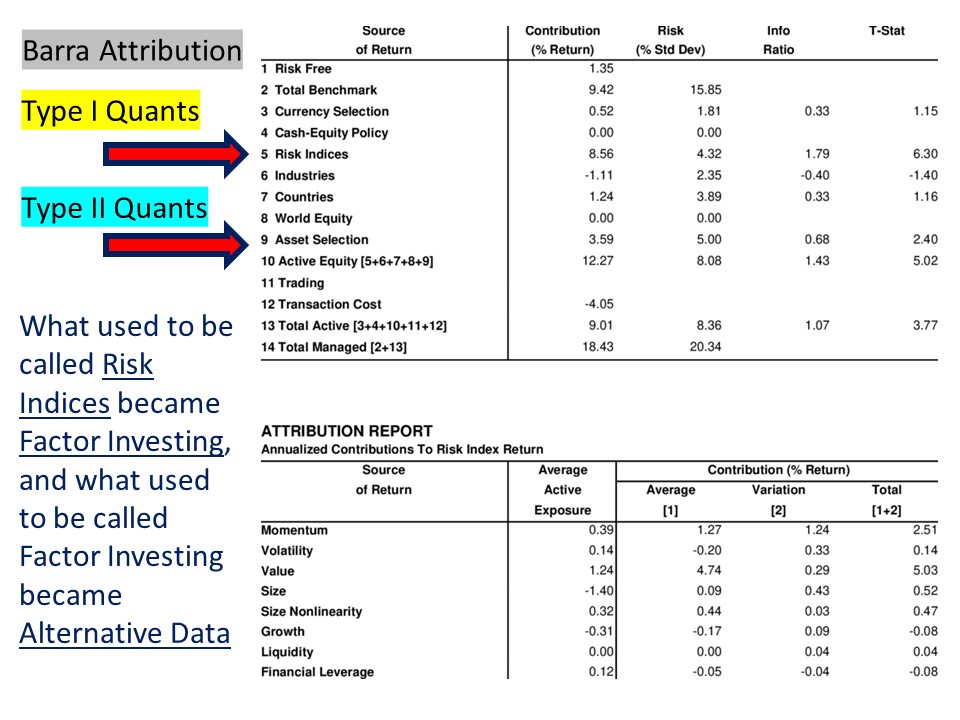
Table from John Guerard’s paper
Although many of the original quant ‘alpha factors’ were grouped under value, momentum and quality themes, which today are widely recognized as factor investing, there was a twist. To win at that original game, you had to come up with factors that were different enough from Barra’s, so that it “wouldn’t eat your alpha” (big headline circa 2008) during the optimization (Step 2). The original quant game was set up to look for factor differentiation rather than convergence.
For example, if you only used a simple definition of value like a universe-wide rank on Price-to-Book, which happens to be one of Barra’s factors, Barra would see the extra risk in your expected return and try to minimize it, shifting the risk budget to the parts of the expected return that are idiosyncratic. On the other hand, if you developed an intricate, perhaps contextual, multi-factor definition of value with various lags, normalizations and adjustments - Barra would not see much ‘risk’ in such expected return and pass it into the coveted ‘Asset Selection’ bucket.
Many described this Phase I state of quant as a mis-specified alpha vs risk factor model problem, but I believe the original set up worked well - especially for the models that contained innovative ideas. Barra cleaned up risk exposures, improved information ratios, and lowered correlation with other active quant strategies. At the same time, risk forecasts remained spot on - and even though conceptually the residuals did contain some extra correlation due to the presence of ‘alpha factors’, their actual impact on realized tracking errors was minimal.
PART II - Things Get Complicated (2005-2009)
Yet, overtime, the ‘mis-specified model problem’ developed into a big ‘headline’ followed by a lot of portfolio construction work building custom risk models, creating pure-orthogonolized-factor-mimicking-portfolios, reverse optimizations and all sorts of complicated but ‘engineering-friendly’ solutions. But risk forecasts were already very accurate so refining them did not produce much improvement in the information ratios. The CIO of Man hedge fund, Sandy Rattray, calls such research projects ‘going down rabbit holes’. It would have been better to continue focusing on the ‘innovation-friendly’ tasks of first moment research - what I call the ‘most significant risk to investing’.
The ‘model-misalignment problem’ was mainly misunderstood because of the different nature of the first vs second moment of factor dimensions. And even though the two occasionally overlap, the segmented specialization produced higher quality risk forecasts and ongoing alpha innovation.
I first encountered this misunderstanding, when I sat down to talk with a senior Barra researcher and told him that my job was to come up with new factors outside of Barra’s risk model to which he replied that it was not possible. “We have all the factors already included in our model” - he said confidently. And since their model residuals exhibited pure randomness, he felt justified making this strong statement.
It was a statement about the second moment. Random residuals meant that their risk model captured all the factors that mattered for explaining co-variances between stocks. But my job was to look for factors that had a positive correlation with the first moment - the cross section of stock returns. If you believe, as many academic-like rational finance driven thinking suggests, that there is no difference between first moment and second moment factors, then, like Barra, you might conclude that all factors have already been discovered.
Barra’s momentum factor is a great example of this mis-understanding. Although Barra’s momentum looks sub-optimal, to put it mildly, as an ‘alpha factor’, it did its job as a risk factor, so they had no reason to make it any better from the return perspective. Of course, as a quant, you would be hard pressed not to tweak the definition and arrive at a much better version. (As a technical matter, their definition ignores the famous 1-month reversal effect, which the investment quants always adjust for like here or here).

From Barra’s Risk Model Manual. Dashed line is the univariate factor return. Solid line is the multivariate factor return, orthogonal to all other factors.
Unfortunately, for the traditional quants, the party has ended with the 2007 and 2009 quant meltdowns, where many of the traditional factors experienced large losses, and quantitative investing went out of favor, making room for the next disruption to enter the stage.
PART III - Smart Beta is Born (post 2009)
In the original phases of quantitative investing, one obvious area remained unaddressed. What about all the ‘Risk Indices’ that actually produced a positive return over time? Shouldn’t those returns also be captured? For example, Barra’s Earnings Yield factor had a very appealing return profile. Why shouldn’t the clients invest in it?

From Barra’s Risk Model Manual. Dashed line is the univariate factor return. Solid line is the multivariate factor return, orthogonal to all other factors.
This is where today’s version of factor investing is born. Driven by the change in client demand for greater model transparency (post 2007, 2009 ‘black-box quant blow up'), today’s version of factor investing provides value by filling this gap, allowing investors to benefit from the historically positive returns embedded in factors that traditionally were placed into the “Risk Indices” bucket.
Today’s factor investing uses the same names and concepts as the original quants used for their ‘alpha factors’ like value, momentum and quality, but the game’s objective has flipped on its head. Instead of trying to get returns from ‘Asset Selection’, factor investors are now getting returns from ‘Risk Indices’. Those are the same risk indices that the original quants tried to avoid betting on.
The traditional quant’s bias against betting on risk-indices in the form of smart beta products was and remains strong, as was reflected in my boss’ early comment. My own bias on this issue became apparent when I was working on a research project in 2007 analyzing one of the early and later very successful (in terms of raising assets) smart beta ETF strategies, that the private equity arm of our firm was considering making an investment in. I ran the standard Barra attribution report on the ETF backtested holdings and saw that all the excess return was coming from a combination of sectors and very few risk indices, with nothing coming from ‘Asset Selection’.
Given my mindset of looking for ‘alpha factors’, to me that looked like a total ‘gimmick’ strategy with no alpha. My report suggested to stay away from this investment. In hindsight, that recommendation was both right and wrong, depending which end constituents you consider. From the perspective of our private equity unit, investing in this new smart-beta company was a great call because their future asset growth by far outpaced traditional quantitative strategies. However, from the point of view of the end client, the asset owners of the underlying ETFs, my conclusion was spot on: this ETF did not deliver investment value since inception and its return was purely driven by the same initial few risk indices it bet on.
PART IV - The Present Day
Over the past few years, as I kept seeing the profound lack of innovation in what became factor investing, I finally realized what I was missing. “Back in the day”, if you said you were factor investing that meant you were constantly searching for new ideas. But as time went by, it seems that the ‘quant game’ has split into two: the factor investing ‘engineering’ game and the continued alpha ‘innovation’ game.
By disrupting the traditional quants in their own game, the factor camp fully embraced investing in static risk exposures without the need to innovate going forward. Traditional factors have been hard-coded into indices and ETFs and the investors can now own risk factors affordably, consistently and transparently around the world.
In contrast, the hurdle for producing innovative alpha has only increased, as both Barra, new factor ETFs, and even Eugene Fama continue to add what historically used to be ‘alpha factors’ into the risk factor models. And so the ‘alpha’ quant camp is stepping up its efforts on the never-ending journey of looking for new sources of excess return, as evidenced by the booming AI and Alternative Data providers and conferences, attended by the many familiar faces of the original quants.
PS.
Additional reference here (see page 90 and 91, Exhibit 5.7 and 5.8)