
One of the most effective performance reporting formats I know is a Cone Chart, popularized by Bridgewater Associates.
Here are some reasons why a Cone Chart is so effective:
It clearly establishes ex-ante expectations of both return and volatility. When actual outcomes deviate within expectations, it’s just volatility, not risk (see Volatility vs Risk)
It effectively captures both the drawdown and low return outcomes which can potentially become risk if the range of expectations is crossed (see Two Risks that Ruin Investing)
It nudges investor to be patient by focusing on the long-term rather than short-term performance, because by default, it is a ‘since inception’ report
It makes volatility feel normal rather than bad, by visualizing known and expected uncertainty
It sets up an objective evaluation of when a strategy stops working
It can handle a very long-run view because of its log-scale
So how do quant’s favorite Value and Momentum stack up in a Cone?
In two words: Totally Normal
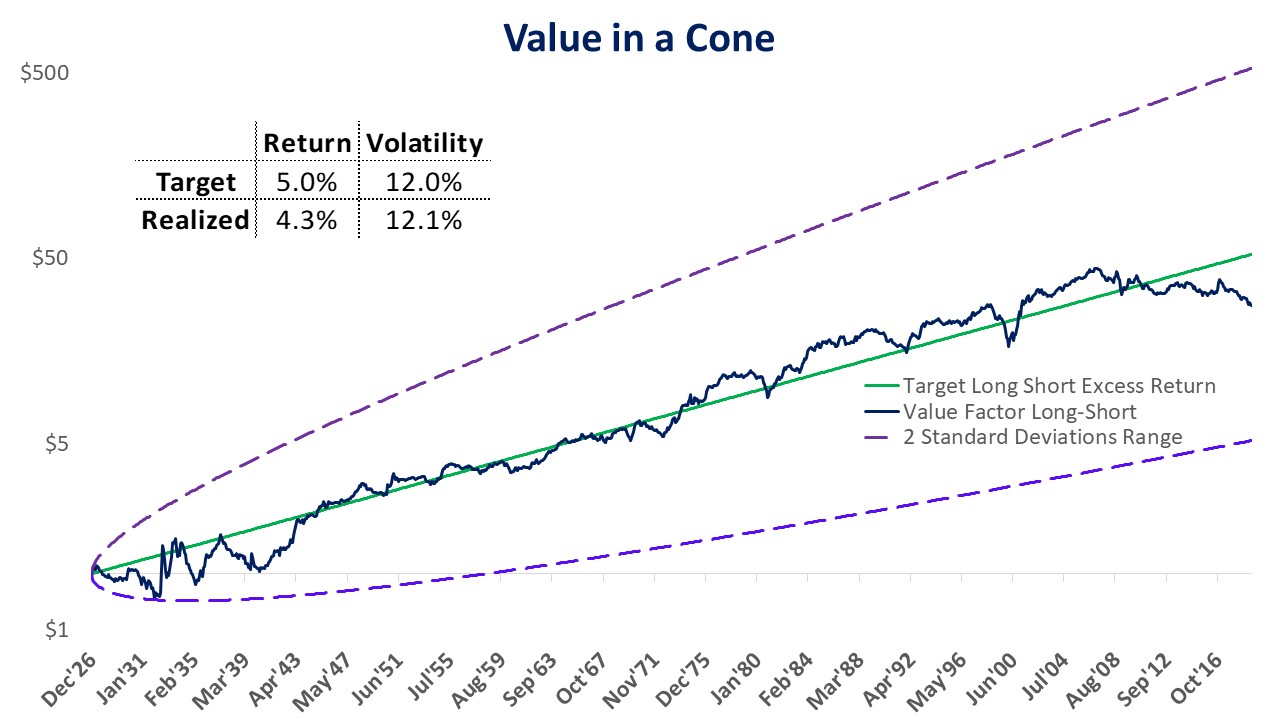
Fama French Value factor as of 6/30/2019

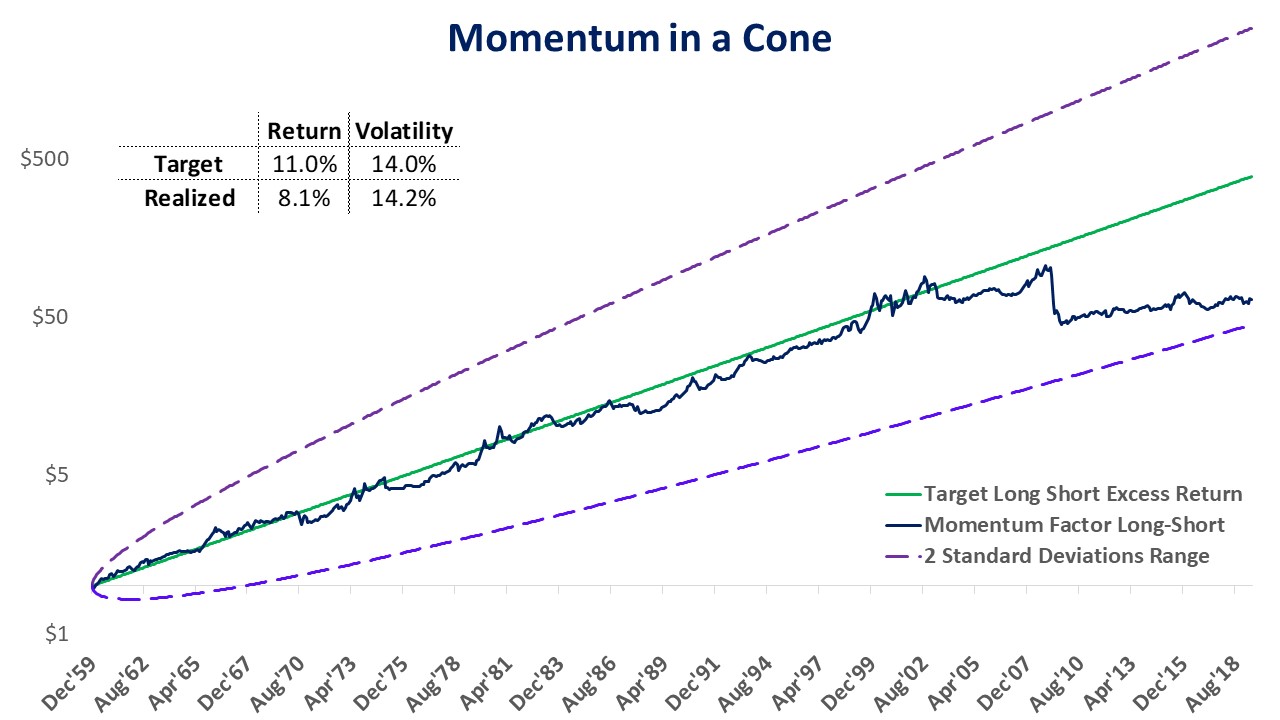
Fama French Momentum factor as of 6/30/2019
Yes, both Value and Momentum have recently under-performed their targets, but within totally expected ranges, defined by the 2 standard deviation dashed purple lines.
Of course, target expectations matter. Above, I use 5% for Value (the excess return on top of the risk free rate), and 8% for Momentum. I also use 12% expectation of volatility for Value and 16% for Momentum, based on their long-run data.
Within these long-run expectations, Value and Momentum are doing just fine, and their Cone Charts are far above the “give up” thresholds.
Now, let’s see what happens if more recent history is used to set expectations, say since January 1960.
Because both Value and Momentum had a strong run from 1960 to 2000, investors could have set higher expectations for return and lower ones for risk based on this shorter history.
In below charts, I set
Value’s expected spread at 6% instead of 5% with volatility of 9.5% instead of 12%.
Momentum’s expected spread at 11% instead of 8% with Volatility of 14% instead of 16.5%.
Let’s see what happens:

Fama French Value factor as of 6/30/2019
Fama French Momentum factor as of 6/30/2019
Even with much higher expected returns and lower risk, both factors are still within expectations, albeit starting to approach the threshold.
So what is the Cone Chart telling us about Value and Momentum?
Do not give up on them yet!
Use a longer history to set expectations (see more here)