People ask why I bother studying very long historical data when the present looks different from the distant past. Here is how my fascination with long-run data started and why I think it is useful to look at it today.
Back in 2004, working at a large asset management firm, I started testing various factors like Value, Momentum, and Quality to build my first quantitative model (which fortunately and uniquely, for the quant space, has outperformed the S&P500 for the past 15 years). Our original data (Compustat Industrial package) went back to the early 1980s, so the back-tests were short, just about 20 years long.
Once the first version of the model was built, I discovered that a longer history of the same data existed back to 1950 (Compustat Historical package). It was a fascinating and nerve-raking experience to test factors on the additional 30 years of history and to see what happens to them. Many survived, some became weaker, others went totally flat. In addition, some factors showed totally new crash properties in the longer data. Reviewing insights from ‘new’ deeper history was a humbling experience which taught me about the need for model-risk management (both first and second moments), idea diversification and constant innovation.
I was most fascinated by the Momentum factor which seemed to defy all notions of rational finance. In academia, it puzzled the efficient market hypothesis guru Eugene Fama, and in practice, it did not fit easily within the investment philosophy of the fundamental portfolio manager and the head of equity under whose leadership I was building the models. In contrast, adding historical data back to 1950’s only strengthened the empirical evidence of Momentum’s ‘invincibility’. So I naturally wondered if I should expect momentum returns to continue to be as good as they looked since 1950’s or whether my boss’ and academic skepticism was warranted?
Then, around 2008, I came across an even longer data set from the Fama-French data library which goes back to 1926. To my surprise, longer history of Momentum returns revealed a huge crash after the Great Depression. To most other quants back then, this early period was a ‘fluke’, an ‘outlier to be ignored’, perhaps driven by poor data of the early years, or the depression which was surely not happening again. After all, the 2000s were so radically different from 1930s, how could such early history teach us anything useful?
But my experience of this “New Past” was different. With each additional data extension, I was effectively moving backwards through time and, as a result, I experienced each new piece of history as if they were a potential future unfolding in front of me. And the Great Depression piece of history was very alarming for Momentum.
Two things happened as a result of seeing this. First, I put a very low weight on the Price Momentum factor in our model, ‘just in case’ it crashed again like this in the future. Second, I became very curious to see if it was possible to look beyond the curtain of the 1926 Momentum start date and go even further back.
This is where seeing the long run graph in Jeremy Siegel’s book “Stocks for the Long-Run” raised these defining questions:
If the U.S. Equity index data exists all the way back to 1800, why does stock-level data only go back to 1925?
If I could find this missing data and test Price Momentum on the additional 125 years, I could then finally confirm if Momentum continues to be positive on the previously untested data (which would argue against it being a product of data-mining).
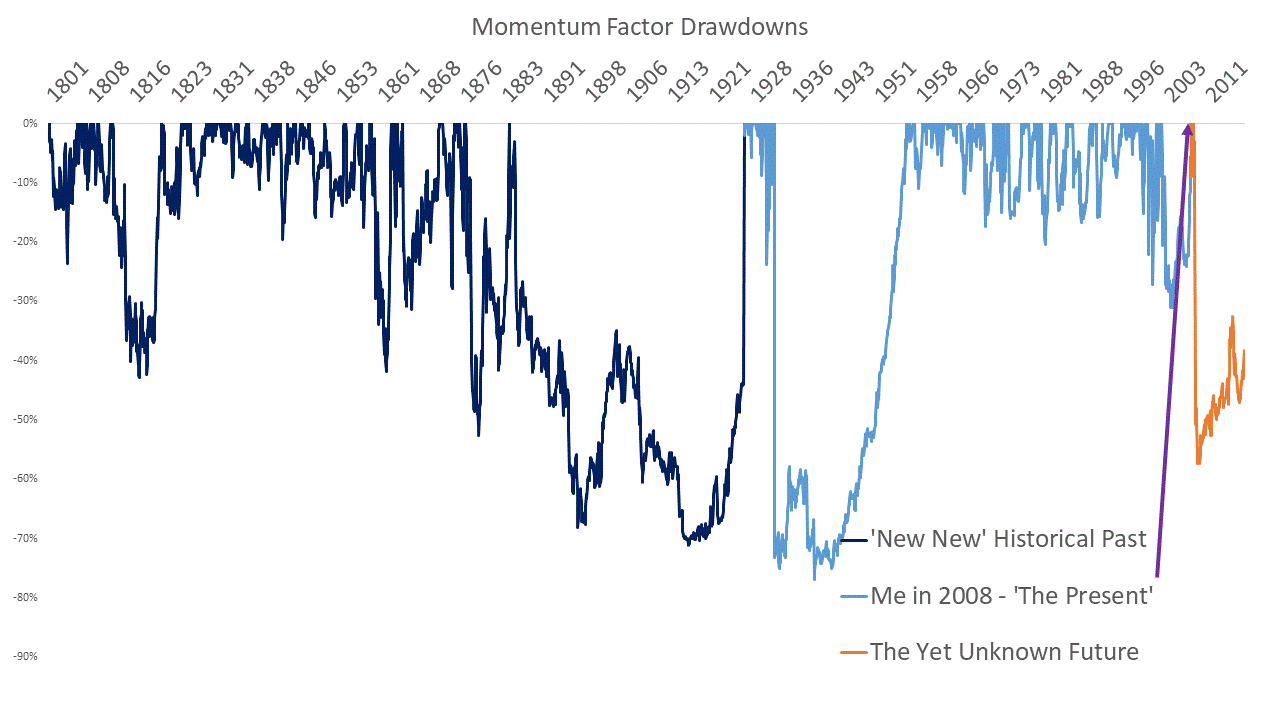
Then, I would also find out how often it crashed to the same magnitude as it did in the 1930s. (Remember, this was back in 2008 and we did not yet see the 2009 to present draw-down part of the graph.)
Luckily, one of my Professors at the Wharton Business School, Chris Geczy, loved this research idea and supported it as my independent study topic that eventually became a published paper. Although it took over 9 years to get the work published, I held my breath as I saw the first results very early on, near the end of 2008. To my painful surprise, Momentum experienced tremendous crashes prior to 1926, but it also delivered a statistically positive return during the additional 125 years of history!
This “New New” deep history re-confirmed my decision to keep a low weight on Momentum. The 1950-2008 history that used to be seen as representative of how Momentum behaved was now only a short part of its full distribution - the “momentum golden years” - and the 1930s extended draw-down now appeared much less unique in light of the longer history. This turned out to be a luckily-timed insight as Momentum crashed in 2009 and has been in recovery mode since then. At the same time, the fact that Momentum continued to deliver a statistically positive return for an additional century and a quarter, says a lot about its staying power as a factor.


